


Today’s challenge issued by Andy via blogpost was as follows:
With Power BI day behind them, we move onto day 4 in which the team will be analyzing drought conditions in America.
Requirements:
- They must use the REST API to download the Comprehensive Statistics.
- They are more than welcome to supplement it with additional data.
- Before 5pm, they must have their data prep complete, dashboards uploaded to Tableau Public, and blog posts written.
A quick Google search will lead them to some fantastic articles and visualizations. I’m really interested to see what insights they find as I wonder if global warming has had an impact on drought conditions or if the patterns are merely cyclical.
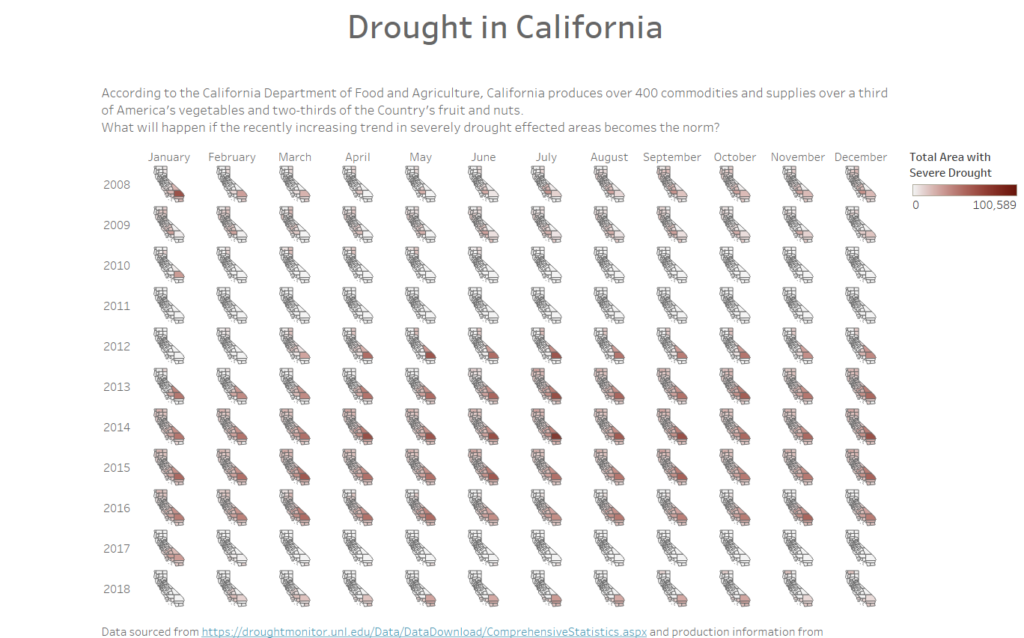
I got off to a delayed start today and in addition to the fun of dashboard week today I also ran a Webinar on Spatial tools in Alteryx today too. I then managed to get my scope all wrong. I got my hands on the data after lunch and wanted to attempt to reproduce some of the cool maps the United States Drought Monitor has featured on their website. You can download shape files from their website a whole year at a time as zipped files. I found
the URLs for the shape file downloads in the webpage html and then attempted to simply modify the URL with each year of interest and then use cmd within Alteryx to unzip the files. Unfortunately I failed to realise that actually these zip files had more zip files nested inside of them so the workflow I was attempting to use wouldn’t work. You can also download the spacial files by each individual collection date. These zip files do not have nested zip files within them so I decided to try and simply modify the URLs to collect the shape files for each collection date between 2001-2019. Spoiler alert: this workflow would take a long time to run. After 15 minutes and only 1% completion I decided to stop the workflow and just try to produce something with the data I had. Time had marched on by this point and I ended up with this very simplistic dashboard:
Although this is far from what I wanted to end up with today, dashboard is teaching me a really important lesson: I can crack something out in a very short space of time. I also don’t need to be afraid of deadlines. Prior to coming to the dataschool, I used to be too afraid of failure to even start things sometimes and although I wish I could be churning out a higher quality of work, I’m already starting to feel like dashboard week is a win because things are definitely getting easier mentally.