


For the second challenge of dashboard week the focus was on creating a dashboard to be inclusive of all potential users, for me a visually impaired user who uses screen reading.
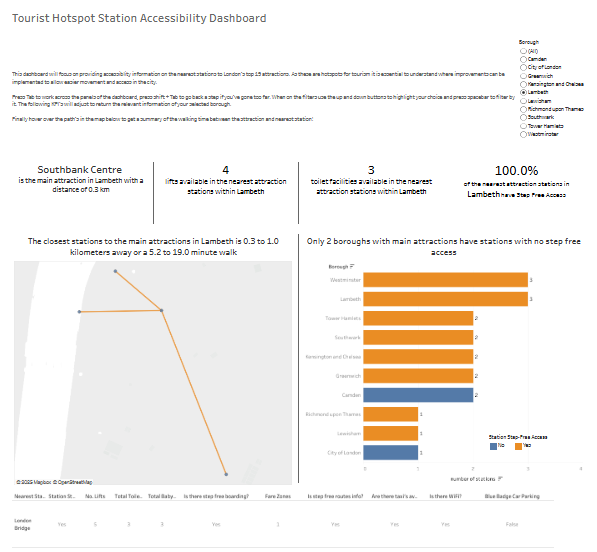
The brief for this challenge was to create a dashboard on general accessibility with tube stations in close proximity to tourist attractions.
The Rabbit Hole
Unfortunately whilst combining the necessary datasets, I fell into the trap of over analysing and focusing on preparing spatial data. In doing so I lost track of time trying to merge the individual longitude and latitude datasets in order to create a dynamic buffer map - forgetting how this may not translate across for a screen reader user.
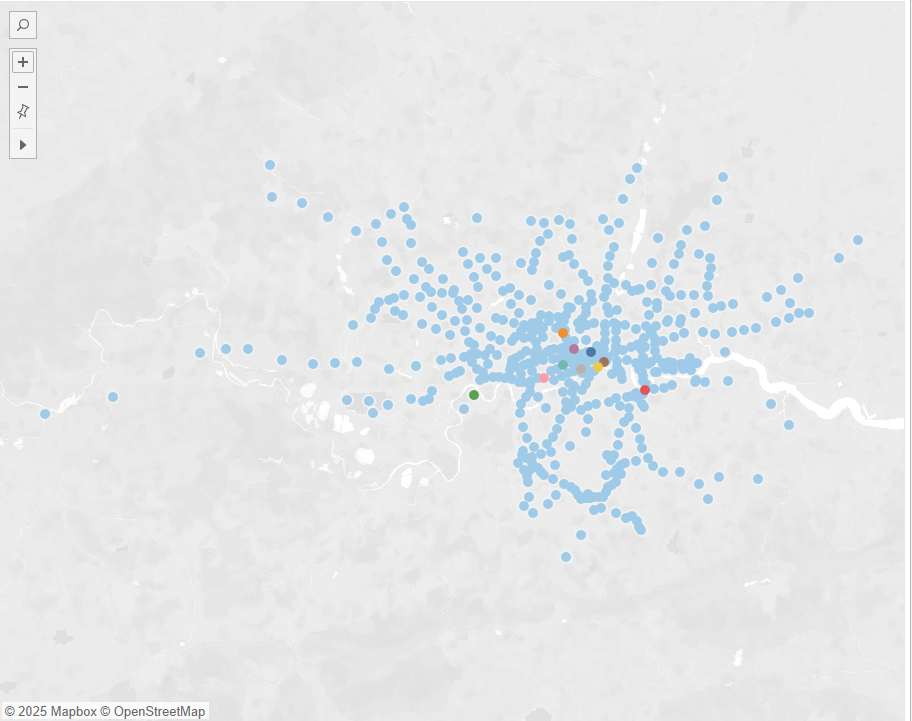
Once I had realised most of my time had been eaten away I used the remaining time to focus on creating the components necessary regarding the brief along with a scaled displacement map between station and attraction.
Creating the components
Once I had correctly identified what measures correspond to what table and constructed the appropriated calculated fields it was time to implement them in a way that worked with screen reading. To achieve this I mainly used text boxes and KPI's created in the form of polygon titles. This worked well when tabbing across the dashboard, however, the screen reader for some reason also tries to describe a non existent visual and the components surrounding it such as filters/parameters/marks.
Due to time constraints the final dashboard didn't work as I intended as I had to quickly fix the dynamic title of the map visual and was unable to fix the summary table visual below it resulting in a failed screen reading of the table details.
Though the dashboard, within the timeframe, did not come out as I hoped I found this challenge interesting taking into consideration various design elements and quirks when constructing the dashboard to be compatible for visually impaired users.
In future I would like to return to this dashboard and polish it off so it works and looks as I envisioned and as such, could be a proof of my ability to implement accessibility options in my visual practises.