


The challenge over these 2 days were based on creating an infographic on a TV/movie etc of choice from IMDB's dataset with a summer theme/summer analysis.
The first challenge was with picking the topic as I don't really watch TV or shows with an outlined summer theme. Once I had established what angle I want to visualise it was time to prepare the data.
The Nightmare
The data from the original workbook was an extract and unable to properly access within Tableau Desktop so it was extracted and imported into Tableau Prep where the nightmare began. From the extracted files none of the tables available had corresponding fields to link them together and there was no way to work backwards from the logic used within Desktop. Trying to understand the logical relationship ate up a lot of time on day 1 as this was a necessary step required to add additional data onto it for further analysis and specific visuals - only to draw the unfortunate conclusion that it was likely impossible to achieve without having the original raw data itself.
The visual challenge
As a result of being unable to isolate the data I was unable to manipulate it in a way that would allow me to create custom charts. This meant I had to continuously change my plans and what my end goal would be since none of my ideas were now possible. I initially thought of doing a heavily formatted figma styled dashboard in the end but thought this would not show the technical flair I wanted.
Hope
Eventually I managed to create several charts and visual ideas for the final dashboard. More importantly, I found a complimentary dataset (essentially the data I was trying to isolate from the IMDB extract) to add on, that required no relation and would allow me to create at least one chart I planned to. In the end my plans changed more times than I can remember but the dashboard I was able to create within the time frame had cool elements though unfinished.
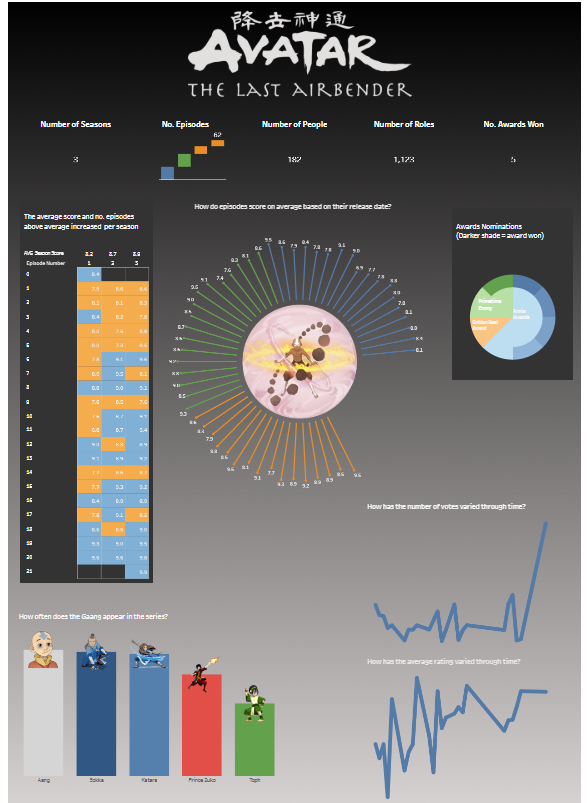
Once again much like my previous blogs this week, this is a dashboard I will be revisiting in the future to finish as I found the visual aspect fun and am a massive Avatar fan.