


When creating a dashboard, it's easy to get carried away in trying to make it stand out or trying to show many things at once. In doing so, however, you lose the main insights that should have been the focal point in the process.
So what should you be aware of to make your point come across?
Double Encoding: Are you showing the same thing in different ways? Why?
Below I want to show how sales varies by region. Despite the trend being clear, it is being shown in 2 ways; through bar length & colour gradient.
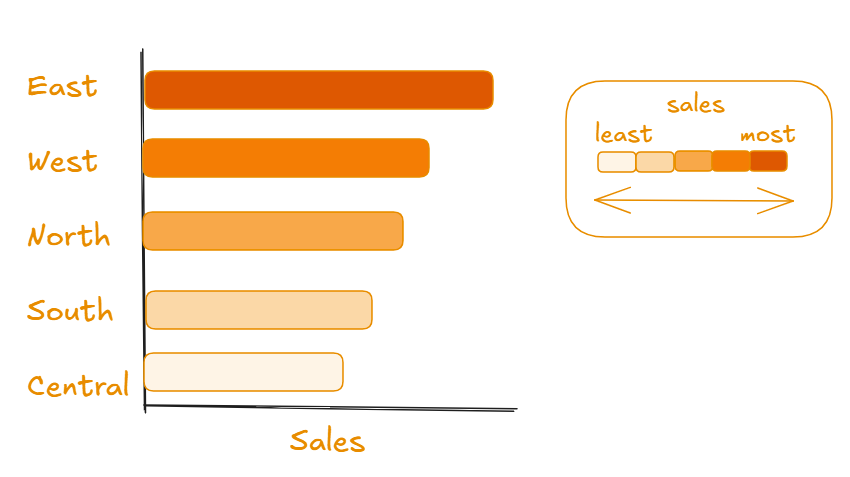
Double encoding needlessly causes attention to be drawn elsewhere, or to the same insight when it could be used to add detail to the chart or emphasise a finding. If I wanted to draw focus to a particular region or finding, colour could be used for that instead of showing the sales variation again. Avoid double encoding as it causes needless cognitive load.
Colour: How are you using it? Is it effective?
Following from the previous example, let's say I want to highlight the East has sold the least of all the regions in the given dataset. Which of the following charts best achieves this?
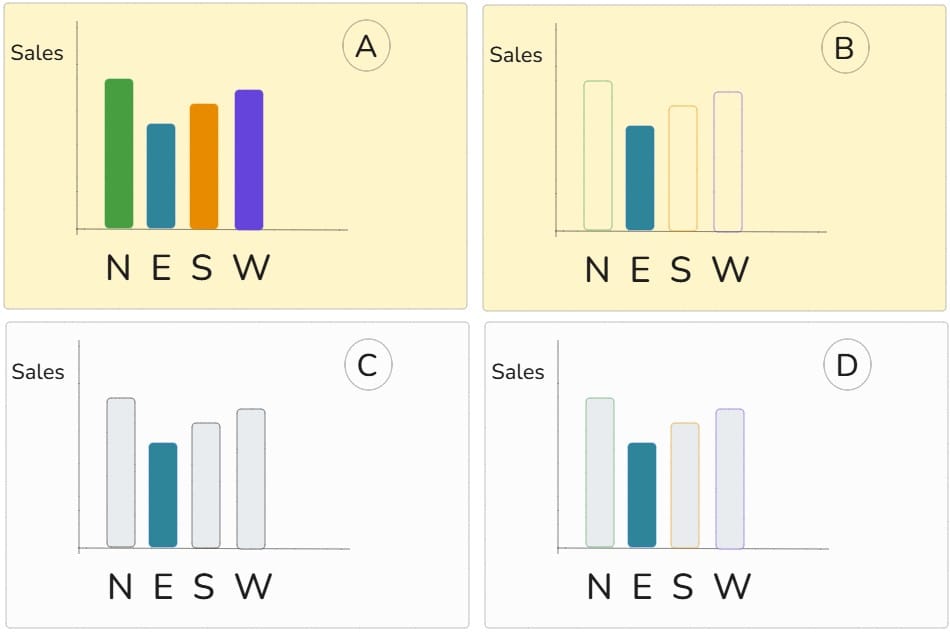
Hopefully you thought it was C, but why?
A,B,D have double encoded the regions through the chart labels and colour use. The background colour in A & B is not necessarily an issue (this time) though it is better to keep colours in dashboards to a minimum so that when colour is used it really stands out (try and stick to shades of grey for backgrounds/non highlighted data).
This is known as the "data-ink ratio" - imagine if the dashboard were to be physically printed, the use of ink should mostly be used to highlight a small amount of specific data out of the total ink used across the entire dashboard.
Top Tip: Try and keep your use of colours consistent throughout the dashboard. For example, if you use orange to show West sales, don't use orange somewhere else for a different metric. Keeping colours consistent makes a dashboard easier to follow.
When using colour, make sure it enhances what you want to show and is not used to make your dashboard/charts simply "look nice"
Layout: Does it matter how your charts and metrics are organised?
Which layout would be easier to look through?
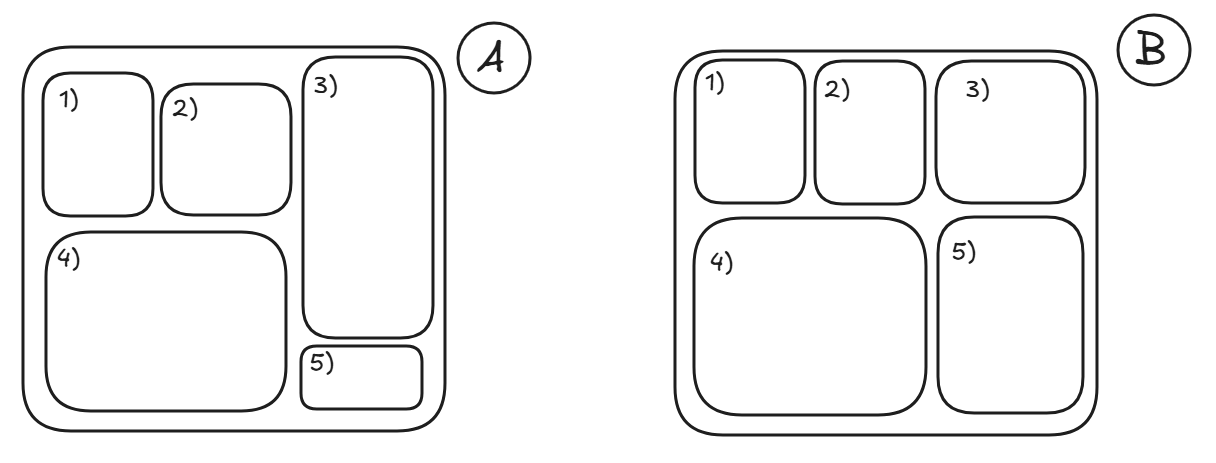
It's a subtle variation but it makes a noticeable difference when looking through a visualisation. The charts being aligned and similar sizes allows the audience to look through as if they're reading through a book rather than having to look up and down and break the natural flow - allowing the information to be easier to digest and look at. Avoid using floating items and place charts and metrics in containers that are aligned with one another.
What else can you do?
A guide of best practices can be a long list varying from padding to text formatting... The 3 topics explored here creates a good foundation of aspects to improve upon fundamental issues beginner dashboard creators commonly experience. Hopefully this blog peaks your interest in the seemingly endless best practice elements to explore!