


Data School Week 11
Week 11 it was back to business as usual with another client project interspersed with training sessions on SQL and advanced Tableau Desktop skills.
Client Project
This project was especially exciting because it was my first time working with data extracts from Google BigQuery. The client planned to connect directly to the Google BigQuery server in Tableau. The client did not allow us access to their server, so they provided JSON extracts of the key Tables/Views. There were separate JSON files for each day for each Table. Figuring out how to recreate the tables from these JSON files was tricky, Neil solved it in the end.
Tricky Bit
We set about trying to recreate the BigQuery tables in Alteryx. The first thing we tried was using a wildcard import to bring in all the JSON files for a given table. The problem was that Alteryx was only importing the first record for each JSON file, so we were missing out a lot of data.
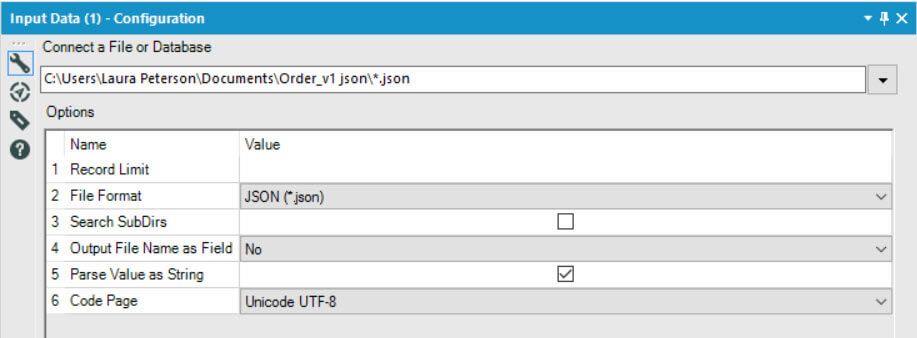
Input Data tool using JSON file format was not working
Neil’s Genius Solution
Neil came up with the genius solution of changing the file format in the Alteryx Input Data tool from JSON to CSV. A screen shot of the solution:
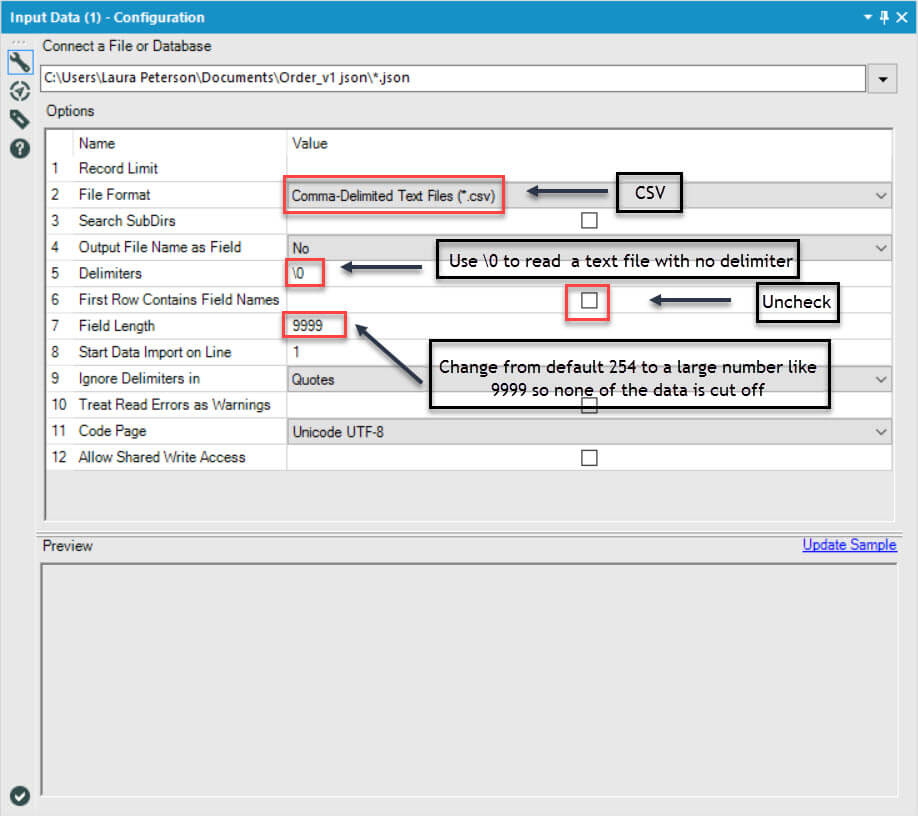
Neil’s solution
SQL Training
We picked up the SQL training from where we left off in Week 9. SQL stands for Structured Query Language. It is coding language that lets you ask a database for specific information. We are learning about the main statement used to retrieve data from a database, the SELECT statement.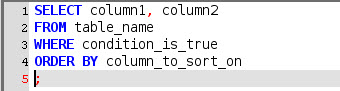
Advanced Tableau
Thursday of Week 11 Carl came in to teach us an advanced Tableau Desktop class. This was my favourite day of the week. Class started by going over all the different types of calculations: number, string, date, type conversion, aggregate, logical, and user functions. During the discussion aggregations, I realised that I use ATTR all the time, but I have no clue what it does or how it works. Carl explained that the ATTR function computes the following formula for every data point in our view.
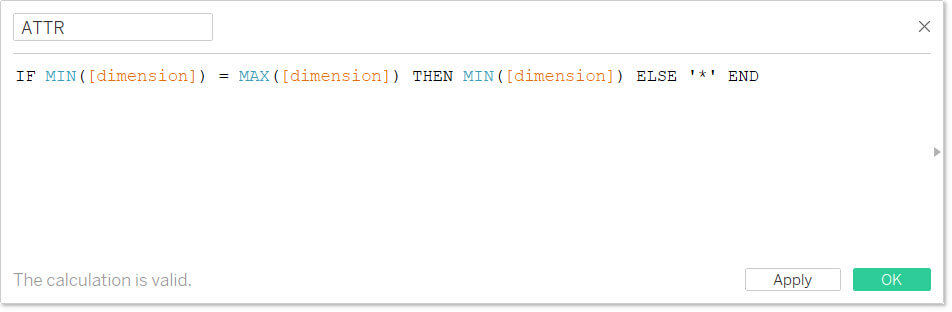
This was so mind-blowing for me that it deserves its own blog. And it has already been written by one of the folks at Interworks. Click here to read it.
Other highlights of Carl’s class included brushing up on Table Calcs and LODs, practice creating control charts and bump charts, and using cohort analysis to analyse customer behaviour.
That sums up Week 11, only four more left before graduation!