


Week 5 – Blog Week
Blogging does not come naturally to me, so I found week 5 of data school relatively difficult. We were each required to write a blog a day, or five blogs for the week. I found myself wracking my brain trying to come up with interesting topics and tips that I could write about for at least 500 words. On Friday we had to present all the blogs we’d written throughout the week. It was truly a struggle for me.
Week 5 – Server Week
Week 5 was also our first in-depth look at Tableau Server. We were each given an AWS server and practised installing Tableau Server. The next day we split into groups, our task was to uninstall and delete everything we did previously then re-installed Tableau Server with active directory authentication. We were given the following scenario to help us understand permissions. It involved setting up users, groups, projects, etc. and making sure all the permissioning was set up correctly. My biggest take away:
- users get roles
- content gets permissions
Tableau Web Editor
As part of Tableau Server week, we learned how to publish data sources to the server and schedule extracts to refresh. We each had to publish three different data sources to our servers, and then use one of them to create a dashboard using Tableau Server’s web authoring environment. I choose to use data about UK Driving Test Centres and 1st-time pass rates; this was of particular interest to me because I passed my drivers exam on my first attempt that Monday. I was impressed with everything I was able to do in Tableau Web Editor, and I liked that it had the same look and feel of Tableau Desktop.
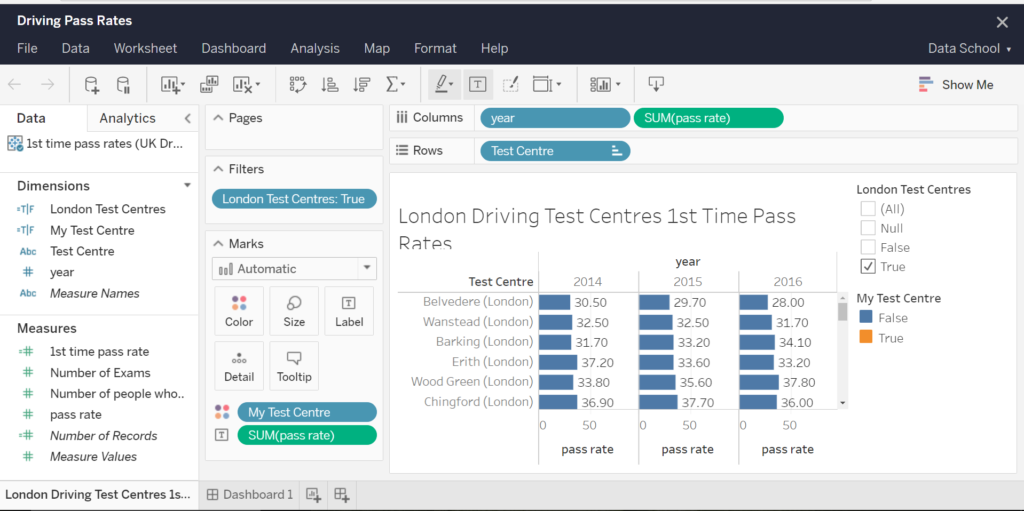
Unfortunately, look and feel are where many of the similarities end. I quickly became frustrated by my inability to things that were easy in Tableau Desktop, such as format my axis to display pass rate with a ‘%’. I won’t elaborate because Tableau Desktop vs Tableau Web Editor is worthy of its own blog post.
In the end, I managed to produce the dashboard below, that shows the first time pass rates for London and highlights the centre where I took my exam. 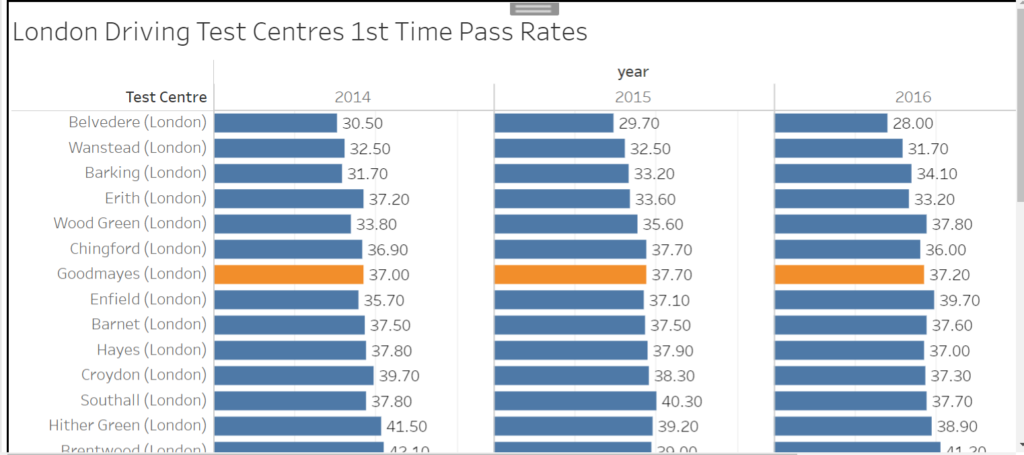
I learned a lot in Week 5 of Data School, but the highlight for me was definitely passing my driving exam!