


After spending most of week one learning about best practices for data visualisation, our first project was to use our new-found knowledge to make over our original Data School application.
Original Application
The viz I created for my application used a data set on global heights of men and women from 1896-1996. Original Application
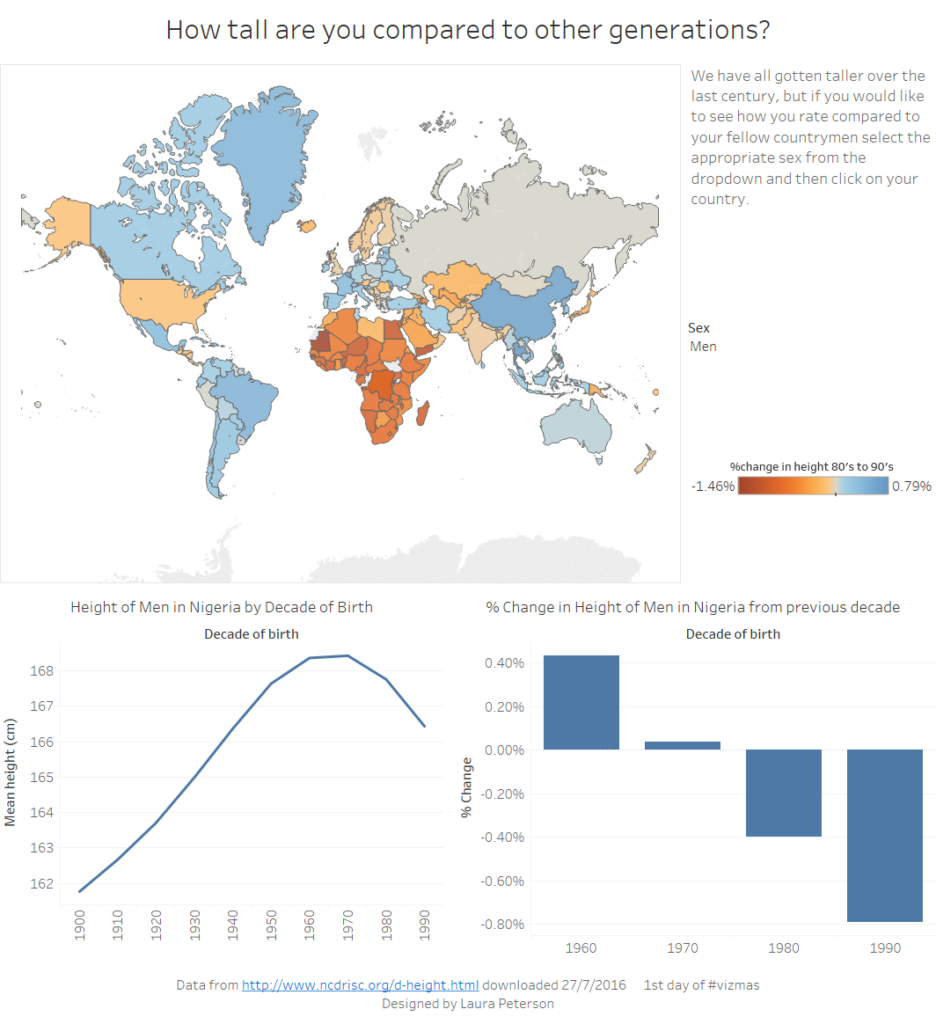
What’s the aim of viz? To allow people to compare how tall they are to others of their gender in their country.
What do I like about it? I like the aim of the viz, but feel like I could have executed it better.
What do I dislike about it? I am guilty of the common Makeover Monday mistake of creating a map just because there was a geographic field in the data.
#FACT: If a geographic field is in the #MakeoverMonday data, people will create maps whether they are useful or not. Maps need a purpose.
— Andy Kriebel (@VizWizBI) February 21, 2017
The map doesn’t add much value in the context of letting the viewer compare their height to the historical average.
How can I improve it? I can add reference lines to the line chart to help the audience find themselves in comparison to the average.
Makeover Version 1
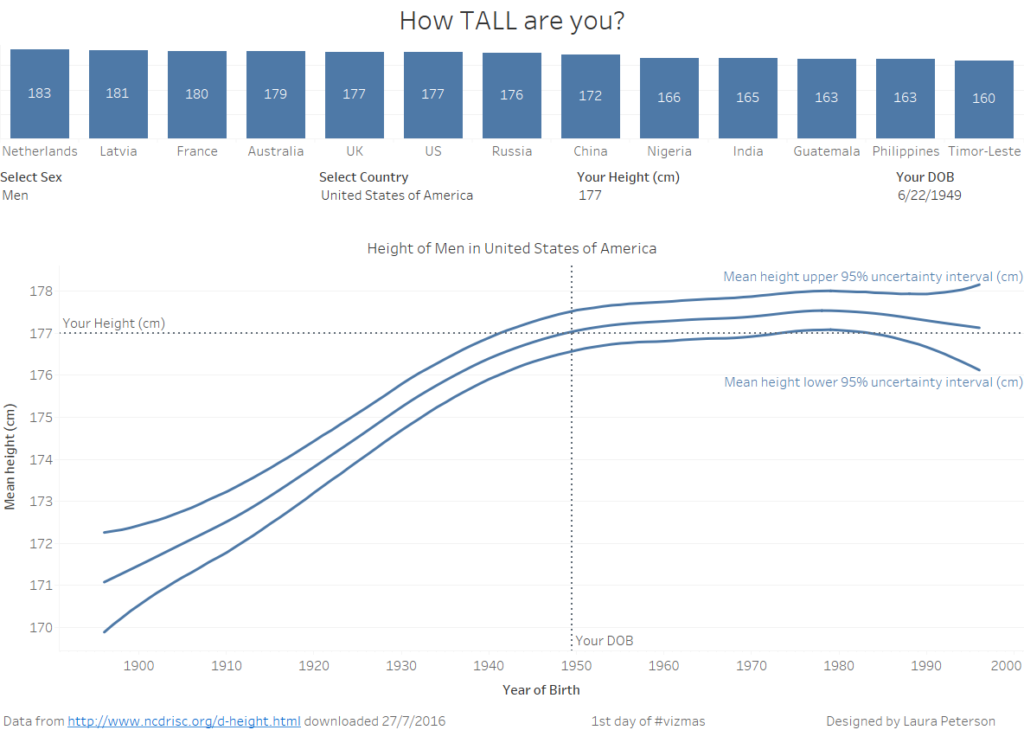
This is the dashboard I presented on Friday.
What works? I was happy that this dashboard did a much better job of achieving my original aim. The user can see how they compare to the mean, upper and lower confidence level of persons of the same gender in their country. The can also see a bar chart of the tallest countries for their birth year.
What doesn’t work? The feedback I got during my presentation was that it wasn’t clear that the parameters controlled both the bar chart and the line graph. Also, that it wasn’t immediately apparent that the bar chart represented heights. I found the feedback process incredibly valuable.
Final Makeover
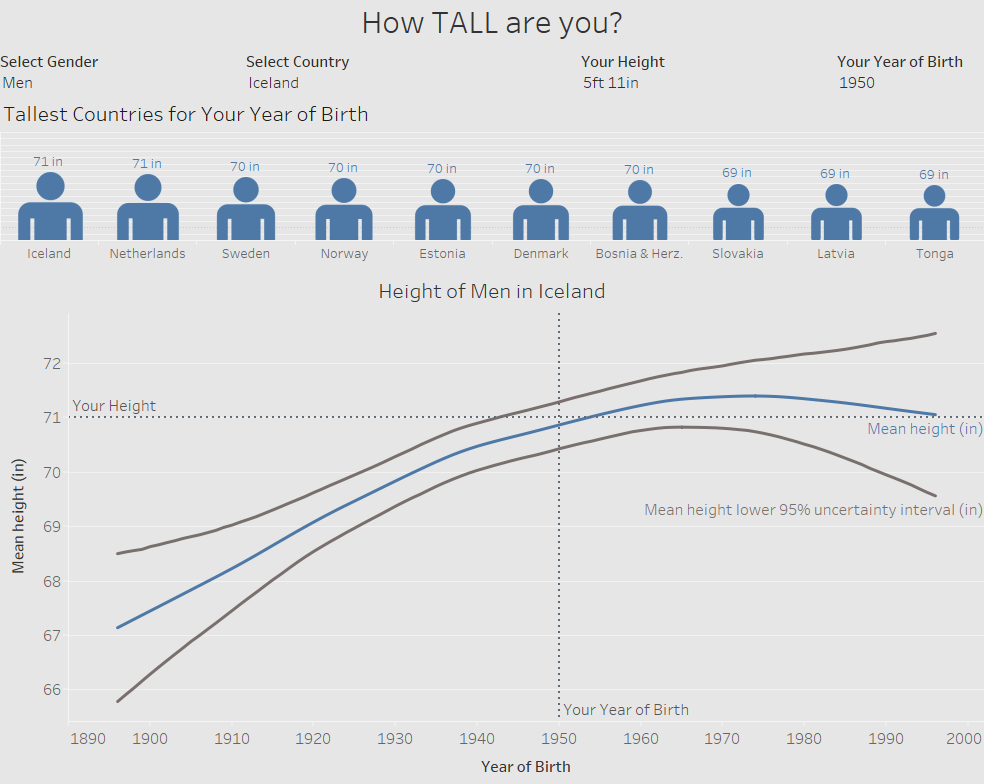
Based on the feedback I received during the presentation on Friday, I revised the viz a second time. I moved the parameter controls to the top, so it’s clear they control everything underneath. I also changed the bar chart from bars to an image of a person to try and make it more visible to the viewer that they represent height. It wasn’t part of the feedback, but I converted the heights to feet and inches from cm.