


Last week project for the Data School, was really interesting but I only had couple of hours to create something on Tableau and present it to the rest of the team.
The project was about Kiva micro finance to entrepreneurs, who cannot afford to open their own business and at the same do not have access to bank loans. What Kiva does is connecting lenders and borrowers through the website. Kiva has helped entrepreneurs in more than 80 countries to finance theirs projects across 15 sectors. WEB
I created a really simple visualisation of the overall project, which is available on Tableau public.
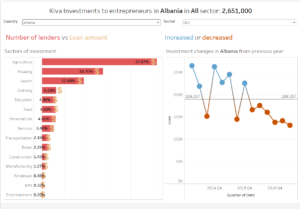
With a blink of an eye it is possible to look at increase and decrease of the amount of loans for each country and sector.
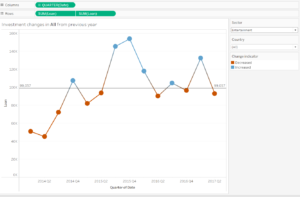
I added a Reference Line to the view to simply break the view and I then added a simple Boolean Calculation as follows.
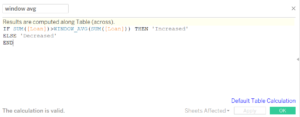
IF SUM ([Loan]) > WINDOW_AVG (SUM([Loan])) THEN ‘Increased’ ELSE ‘Decreased’ END
Just drag and drop the calculation into the Colour Marks and your view is ready!
I hope you find this useful and please if you have any feedback or questions please do not hesitate to contact me on Linkedin or Twitter.