Today I sent 45 minutes in building a really interesting Dashboard, as an Italian. I used the latest dataset created by Andy Kriebel during his last restaurants visit in Rome at the beginning of April 2018.
Easy and effective way to build a Dashboard in a short period of time is to use small tricks to transform a visualisation into a linked and interactive view.
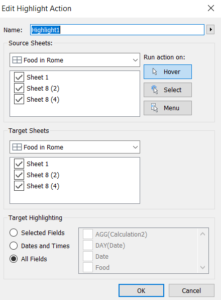
Dashboard or worksheet actions can be set it up as either filters or highlighters. When creating an action it is important to select the source and target sheets.
For this week project, I decided to use Highlight with hover as a dashboard action.

The highlight helps me in this case to correlate each sheets within each others without even clicking or filtering. In fact by hovering over, all the related field will be highlighted in yellow.

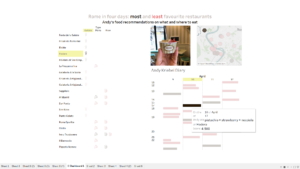
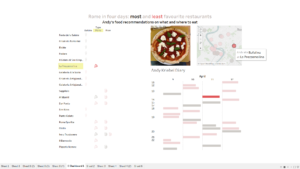
Another way of visualising Andy’s food behaviours in Rome, was using his picture gallery. This time with a worksheet action, I managed to show Andy’s pictures, which are available in the data set with an URL field. Simply add the action by selecting on URL and picking the desired field, which has to be in details in the view in order to change by hovering over different parts of the dashboard.

Now repeat this one more time, to be sure that by hovering over any part of any sheets an image of Andy’s meals will show up. Nice and simple!

Now enjoy Dashboard actions and explore Andy’s recommendations on Italian food in Rome.

