Today during a client project I learnt a really easy way to visualise words on Tableau and it reminded me about one of my University projects analysing survey data.
I find this visualisation very useful where there are just a few words to be visualised, which repeats more than once.
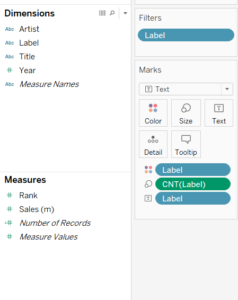
Among your dimensions click and drag a string field into text and then into size. Click on the green pill of size and select measure -> count. To add some colour just drag and drop the field into the colour mark.
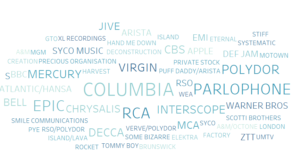
The bigger the text the higher the number of the count. It is really helpful to see the most common answer in a survey qualitative data or to analyse the most popular word in a song. As easy as it looks, here you go: your word cloud is ready!