Businesses often need to create a forecast in order to strategically plan their investments or simply their effort. A really good way of doing that is through Time series tool on Alteryx. The main reason behind forecasting is to capture genuine data on a cyclical basis.
The requirements for forecasting: data field at a constant interval, the longer the time the most robust the prediction.

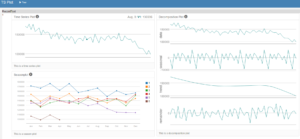
Given a series of months or years, it is possible to create a forecasting model, which takes into consideration the behaviour of the existing data. I have used a data on Methadone as an example for the forecast. The TS plot forecast tool is a really good example of better understanding the time series data and determining how to proceed in developing a forecasting model.
The TS forecast tool also has an interactive report version which allows to have a better insight of the forecast. The TS plot shows trends changing overtime at a seasonal level.

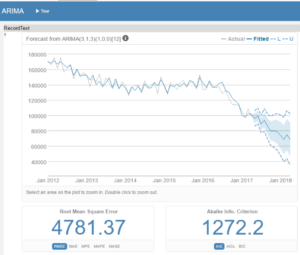
For the creation of the model, it is vital to create a sample of the data, through the sample tool autoregressive integrated moving average (ARIMA). It is also important to create models and compare between them, through another Alteryx tool called TS compare.

Two models can be compared within time series in Alteryx: ARIMA and ETS. The former takes the whole period into account and it minimises the error; while the latter puts more weight to the latest observation. The TS compare tool, represented by a scale symbol, is therefore vital to look at the different models. Overall the ARIMA model appeared to be the best among the two.

