Today’s project is looking at the Southern Oscillation Index with the data downloaded from NOAA website. This index is calculated by analysing the sea level preassure in Tahiti, Australia and Darwin, French Polynesia.
SOI = (Standardised Tahiti – Standardised Darwin) / Monthly Standard Deviation
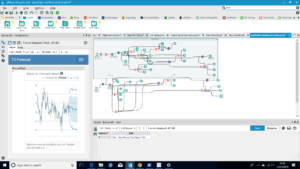
First step of data preparation was extracting the URL with Download tool and parsing the data with the XML tool in Alteryx.
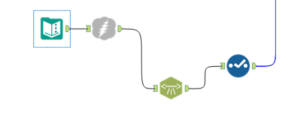
The second stage was more a data exploration of forecasting, by first comparing the Arima and the ETS models.
The latest step of the day was to create a Tableau visualisation on the topic, now available on Tableau Public.
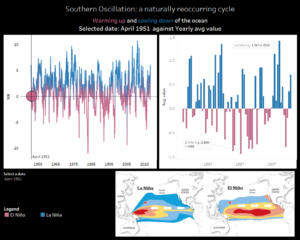
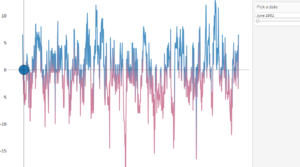
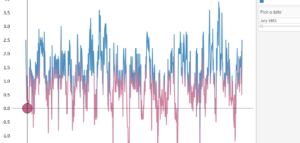
I decided to create something simple, with a brief explanation of the topic through a picture of Los Niños at the right bottom and two times series analysis, respectively by months and by year. The chart at the top left is also interactive through the use of two parameters. It is possible to select a date from the drop-down menu, which will not only automatically update the title, but also the big circle, which will adjust also its position and colour accordingly.
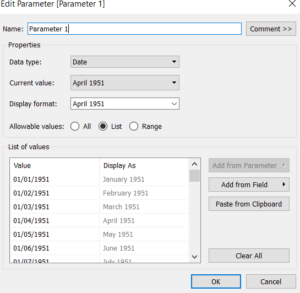
It is very simple to recreate this chart with reference lines in Tableau. Create a Pick a date parameter from the Date field and customise your display format for a better visualisation practice.
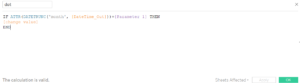
Show the parameter in the view and insert it in the view with a Calculated field, representing the selected date in the parameter, later becoming a circle.
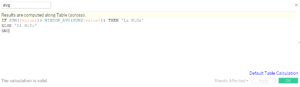
Put this calculation in the view, together with the value change calculation as a dual axis and the boolean calculation to determine the different phenomena names of Los Niños. Drag and drop this last calculation into colour to split the view.
In order to create the two moving reference lines, right click on the Date axis and select add reference line, from the pick a date parameter.
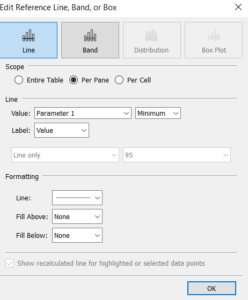
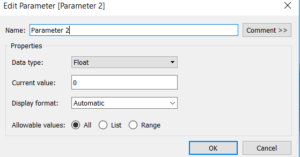
Create then another parameter, not to be shown in the view, to not influence other sheets in the dashboard. Right click the y axis and add reference line with the created parameter, which is created as a single value of zero.
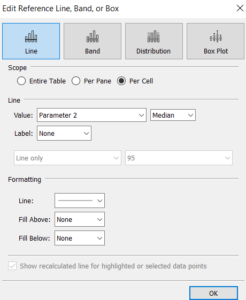
Edit the reference line in the y axis by adding the Zero value parameter with the Median and no value shown.
Now each value will dynamically change with the parameter control!