Decision tree analysis, as a predictive learning, is used in Statistics, Machine Learning and Data Mining in order to visualise data for decision making. The main goal is to create a model that predicts the value of a target variable based on several input variables. The decision tree is a good example of supervised learning that uses a binary classification (yes or no value). All values have a categorical discrete or numerical outcome.
Some basic definitions of the terminology used:
Machine learning: is a field of computer science that gives the computer the ability to learn with data, without even being programmed. Examples of machine learning is data filtering of Junk mails; preferences and suggestions on Spotify, Youtube, Netflix; handwriting recognition; understanding of customer’s behaviours.
Supervised learning: learning a function that maps an input to an output based on example input-output pairs. It is the machine learning task of learning a function that maps an input to an output based on example input-output pairs.
Classification: In the terminology of machine learning, classification is considered an instance of supervised learning, learning where a training set of correctly identified observations is available. The corresponding unsupervised procedure is known as clustering, and involves grouping data into categories based on some measure of inherent similarity or distance.
Regression: a set of statistical processes for estimating the relationships among variables. It includes many techniques for modelling and analysing several variables, when the focus is on the relationship between a dependent variable and one or more independent variables (or ‘predictors’).
A practical example of supervised machine learning using the classification is the decision tree model. The goal is to create a model that predicts the value of a target variable based on several input variables. For the classification tree purpose, the target field member is a category set; whereas for the regression tree model, the target field is a continuous value.

Practical example of a decision tree on Alteryx, using the Iris data set example, where a sample is created with a 70% estimation and a 30% validation. In the data sets there are three different types of Iris, which have all different sizes; there are 4 measures: the sepal width and length, the petal width and length. The following decision tree has a classification type, which uses a category set as a target that in this case is the Iris types.
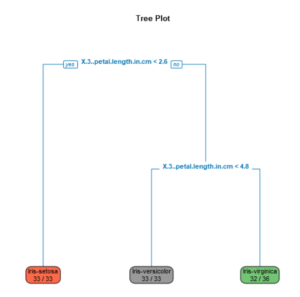
The following Reports shows the decision tree build on Alteryx with the decision tree model. The tree plot shows in a more static way the classification of different Iris types and characteristics. It clearly shows that Iris setosa has a petal length < 2.6 cm, Iris versicolor <4.8 cm and virginica >4.8 cm, all using a binary function.

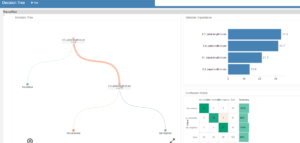
The interactive report of the decision tree on alteryx shows the classification in a more dynamic way. When hovering over on the report it is possible to see the iris percentage split of the all types: setosa 32%, versicolor 36% and virginica 31%. The branch on the left indicates petal length < 2.6 cm and it is represented by Iris setosa entirely. Petal lenght <4.75 is represented bt 54% of Iris versicolor and 46% of virginica.

The iris example is a really simple way to explain the decision tree classification modelling for supervised machine learning.
