


Day 5 was probably the most complex among the days of the week of Dashboard week since it required a presentation early in the morning, a 4 hour project and another presentation in the early afternoon. Being also the last day of dashboard week, it carried not only the stress but also the knowledge. Although I only had 4 hours to build a dashboard that day, I felt much more relaxed about it compared to the first day. It was probably because I have been presenting every day during the week or because I have learnt so many new things that I could apply much faster than before. Having said that in 4 hours it is not easy to create something you have never done before and try to learn new techniques. That is the reason why I focused on being able to tell a story, present it in a clear way and easy to understand it.
What I have essentially learnt this week it is time management: how to manage my time effectively in order to deliver a task in the given amount of time. Managing the time effectively means also understand what it is feasible to achieve during the time available and make the best of it.
The data set was looking at the London Air Pollution in 2017 for each borough for each day and hours. The first approach that I took towards the story was to find a common striking feature, which all the borough had. By looking at the data, I saw straight away that in all the borough there was a peak in terms of emissions of billion of milligrams during the 23 January 2017. That is what made me do a quick research online, in order to link the story to the news. I have in fact find out that that day London had a pollution alert, as described by a BBC article of the 23 January, indeed.
I have therefore used the article as a hyperlink on the dashboard, through the dashboard action technique. I have also used other dashboard actions such as filter, highlights and hide sheet for the hourly breakdown.
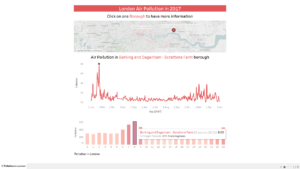
I have therefore opted for a very simple dashboard with a map to show the borough with the labels marks, a spark line which filters according to the borough selected and a bar chart which filters down according to the day selected on the spark line. I then formatted everything to make it easy to understand.
Once the dashboard was ready I then focused on the story to tell to the audience, the insights I have found through my analysis, which is the most important characteristics of data analysis.
Dashboard week project has helped me to learn quickly and efficiently in the given period of time by understanding my limit or expanding my knowledge, create a story easy to listen and to see, be able to work in a fast and accurate way at the same time.
The project also taught me what not to do and what to avoid: over complicate the task or simply taking the long and difficult way of approaching challenges, not to be a perfectionist when there is no time or space to be, not to focus on formatting and design too much.
I feel like I have learnt a lot in a week and I highly recommend creating a visualisation a day for all the newbie in Tableau, it really helps moving on to the next level of learning.
Things to do during Dashboard week:
- Understand your limits (time, data, knowledge)
- Expand your knowledge, learn something new every day
- Create a story easy to follow, find insights and show them
- Organise your time to work at pace
- Not over complicate things