Using Parameters in Calculated field can improve the quality of your visualisation, since it is possible to show different things without overcrowding the Dashboard. Parameters can be used in different ways on Tableau, for instance to flick through different measures in the same sheet.
#1 Tip: create a parameter to pick a filter
Create a parameter to pick a filter can offer the option of visualising a list of measures without creating several charts. This little trick also adds interactivity on the visualisation. It is very simple to create in just a couple of clicks:
Create a parameter with a String data type and select a list of values, which match the exact name of the measures to be included in the visualisation.
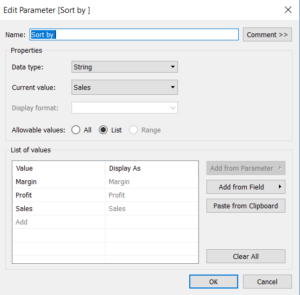
Use the option to show the parameter in the sheet and use it in a calculated field to allow the link between parameter and action in the viz.
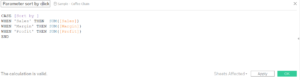
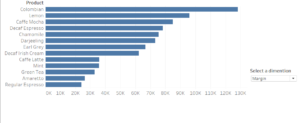
Sort then the dimension by the selected parameter to allow always sorted values in the view
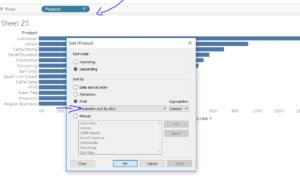
As simple as it is, now it is possible to just click on your Parameter which serves as a filter
#2 Tip: Dynamic dimension
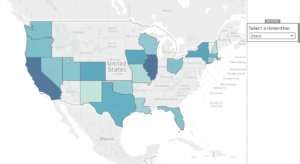
Another application of the parameter is the dynamic dimension to allow different sheets to be hidden when not used on a Dashboard. This allows to show data as required by the user. More data is then available without overloading the dashboard with several charts.
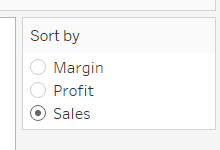
As the example above it is possible to create a parameter with the ‘Sort by’ list and then create a calculated field, which links it to the visualisation.
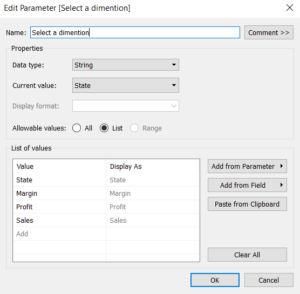
After the above steps create another parameter in order to select a dimension with a string data type and a list of different values.
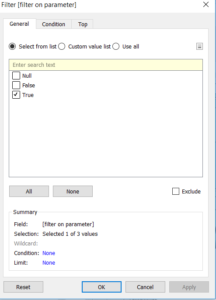
Create a calculated field using the Boolean function in order to include and exclude values from the dashboard.
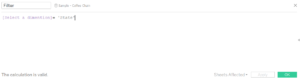
Drop the calculated field into the filter and select True and it will show State and in the other sheet follow exactly the same steps but then select false.
Remember to also hide the title from the sheets and build the Dashboard with the parameter as a filter sheets control that allows to switch between different visualisation types by just clicking on the Select a dimension filter.