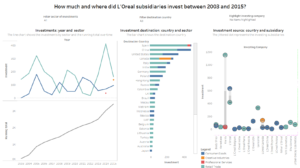
As part of the application process for the Data School, I was asked to create something on Tableau Software with any data set. After several searches, I found a data set on Multinationals foreign direct investment, which has been sent by one of my Lecturer during my Master in International Business Management.
At the time of the application on Tableau, I used the data sets and manually copied and pasted on an Excel file all the useful information for the creation of the data visualisation. Except from the time consuming process, I also realised that my data set was not perfectly drafted.
The visualisation on Tableau is showing at the amount of Foreign Direct Investments undertaken by each of L’Oreal subsidiaries to each destination country, between 2003 and 2016.

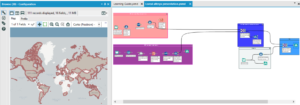
After a week at the Data School, I learnt how to improve my data analysis on Alteryx Designer. I have cleaned my initial data set and I have also supplemented with a new data sets about GDP per capita. On Alteryx, I have used several tools such as: Formula, Filter, Select, Sample, Summarize, Dynamic Rename, Transpose and Join tools.

As a result of my first project, I can now remake the Tableau visualisation for my second project at the Data School. For the second project, I am going to analyse the correlation between jobs created by L’Oreal Foreign Direct Investments and the effects on the countries’ GDP per capita, in order to see the multinational impacts and approaches worldwide.
