This week has focused on extending and improving our Tableau knowledge, firstly with learning some Tableau Server and then followed by with Tableau Intermediate training.
With Andy busy interviewing for the next DS, he left us in the capable hands of Peter Silvester of DS4 to learn Data Connections. Our task for the morning was to take one aspect of the topic, learn it, and explain it back to the rest of our group. Teaching others can really help you to understand a topic, or that is the idea anyway, and so here’s my explanation of cross data source filtering in Tableau:
Filtering across multiple data sources was a feature that came out with Tableau 10 in 2016 and, according to the Tableau blog, was one of the most requested features of all time. It allows you to add sheets from different data sources to a dashboard, and filter the sheets by the fields they have in common.
In order to do this, you must first create a relationship between the two data sources. This is done by opening up the Relationships box from the Data Menu> Edit Relationships. Tableau may create the relationship automatically if your data sources have fields in common, but it’s a good idea to check that it’s using the field that you intend it to. You can do this by choosing “Custom” in the Relationships box. This is also the way to do it if you want to create a relationship on fields that might have slightly different names across the data sources.
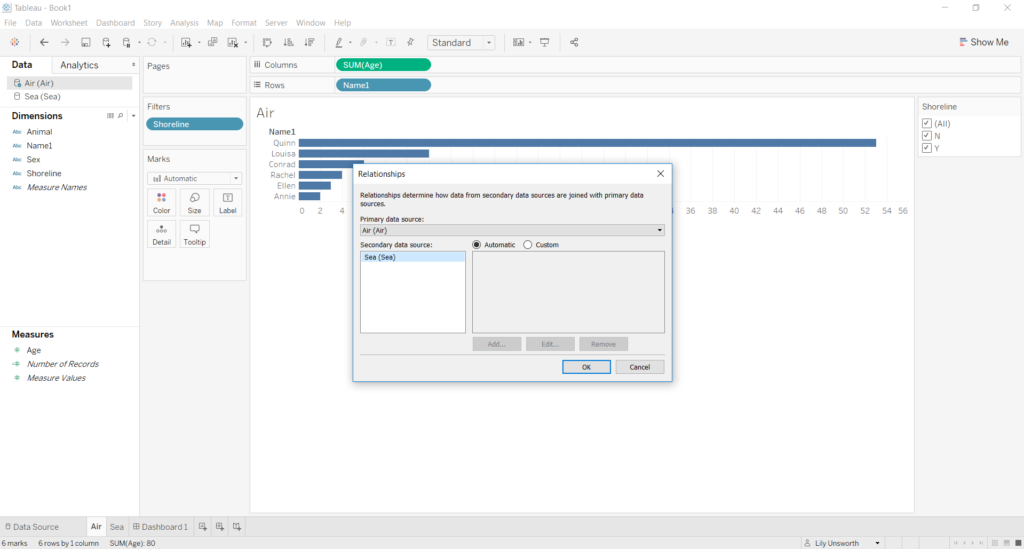
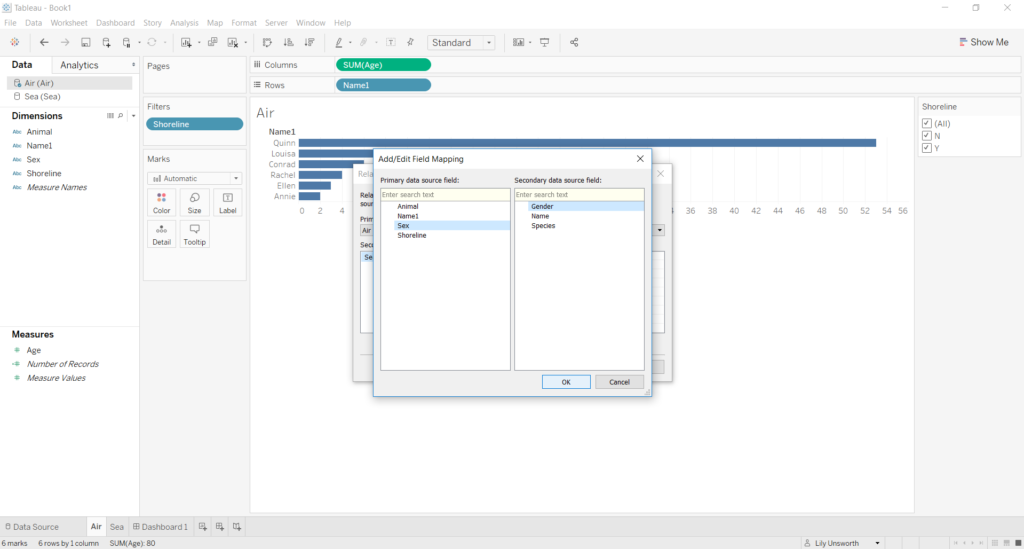
Once you’re in the Relationship box, select “Custom” and then “Add…” to bring up the the Add/Edit Field Mapping dialogue box. From here, select which you want to be your Primary and Secondary data sources. Then add your relationship, and specify the fields you want to relate by in the Add/Edit Field Mapping dialogue box which comes up. Then, OK your way back out of all the boxes and congratulations cupid, you’ve just set up your relationship!
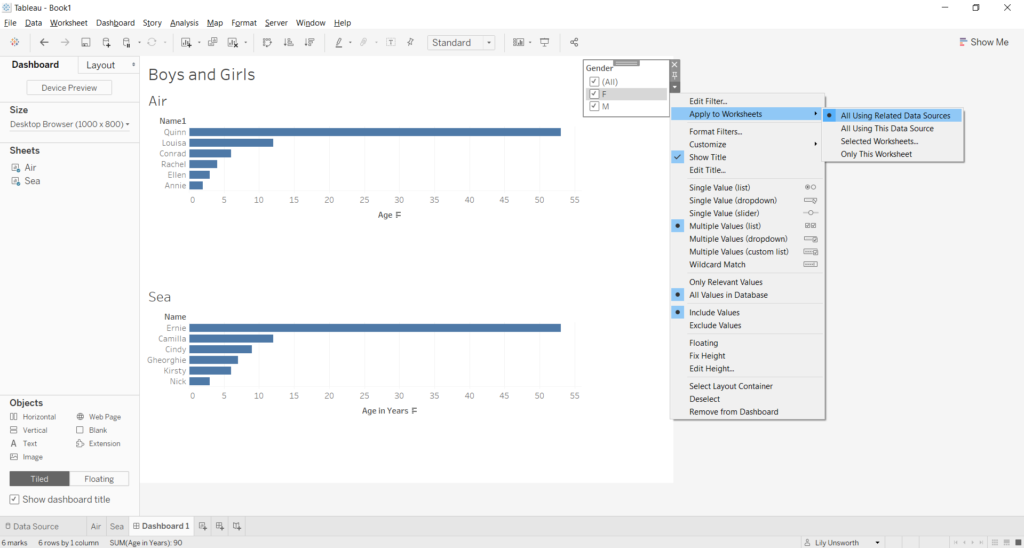
The final step in cross data source filtering is, surprise surprise, adding the filter to your worksheet. You can do this to the worksheet, or directly onto the dashboard via the analysis menu. You can then decide whether to apply the filter to all of the worksheets or a select few.
Once you’ve applied the filter, you will see that the icon for your data source will change to indicate that they are filtering or being filtered. The pictures below indicate what this looks like on both the filter and the “filtee”, with the dark grey coloured database representing the primary data source.
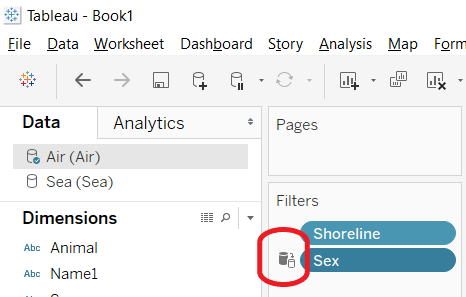
With Air as primary data source, using “Sex” from Air to filter both data sources
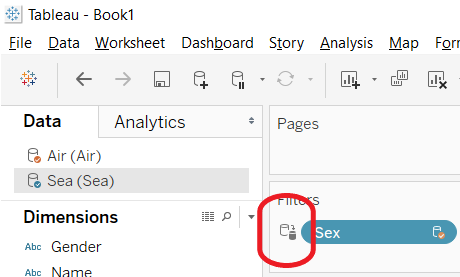
With Sea as secondary data source, using “Sex” from the Air data source to filter Sea.
So, that’s how you filter across two different data sources! Thanks to Nick for the beautiful data sources to illustrate my points.
