


Last day of training, we were given a task by Lorna about Bike Counters in Seattle. It is government open data source with both csv output and API JSON output, so the task looks to be easy, until...
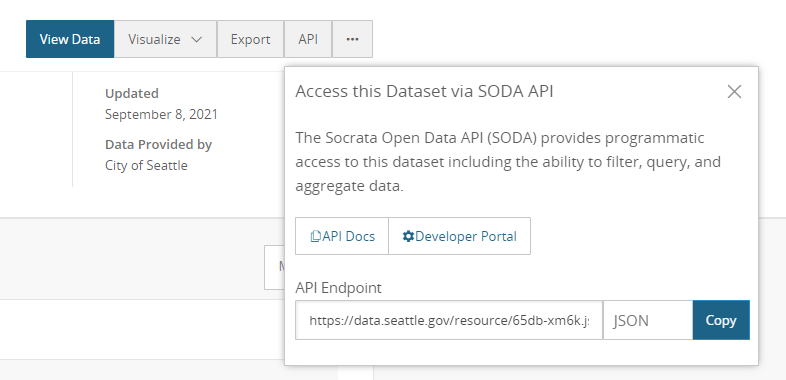
For the initially enjoyable hour, I downloaded the data through API call, with the aim to keep it future proof. The site offers direction link to call.
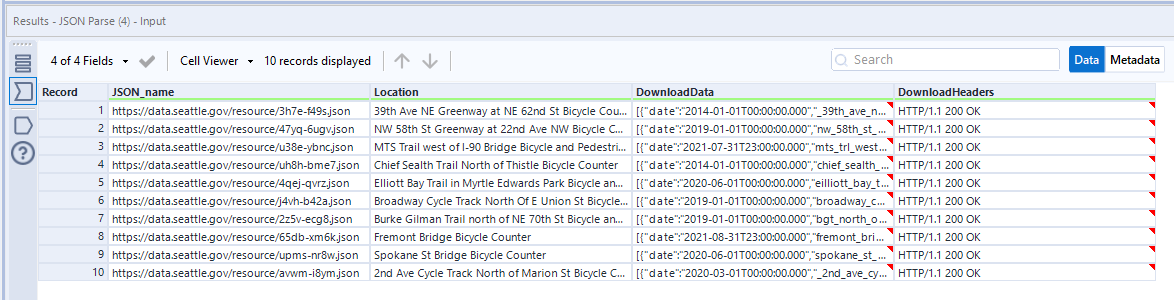
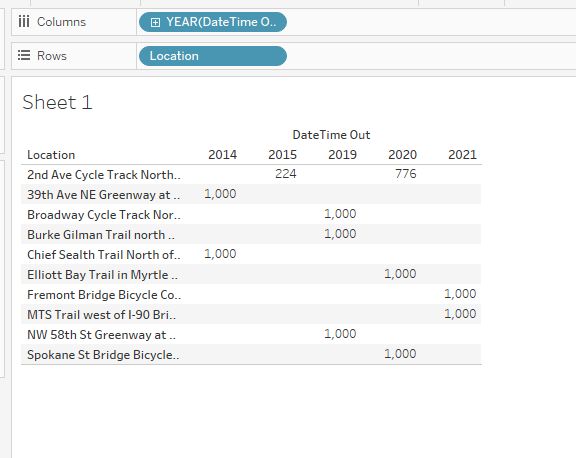
Nightmare starts to occur when I JSON parsed the data, and noticed every Location has different column names and some of the location even has pedestrian data which make the Total value non-comparable. Also the direction of travel is not universal as some street/road is east-west while others are north-south.
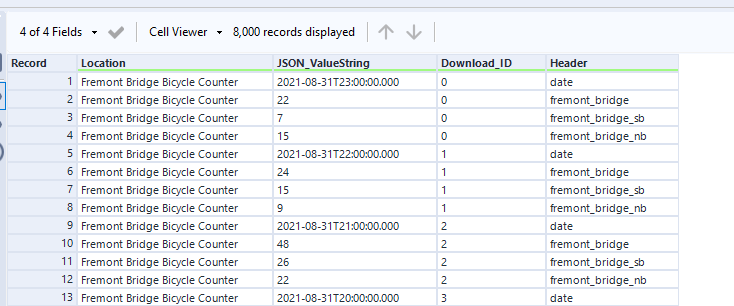
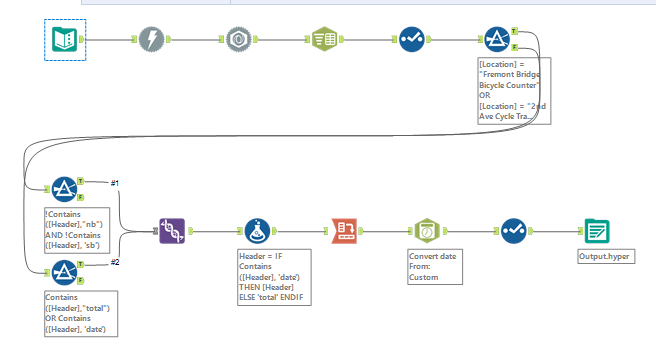
So to handle various format I decided to use only Total for all Locations. The data prep took a bit longer than anticipated, as I noticed from the output some Total are missing.
Note: not all Location has word total in it, hence the failure in formula in Filter tool.
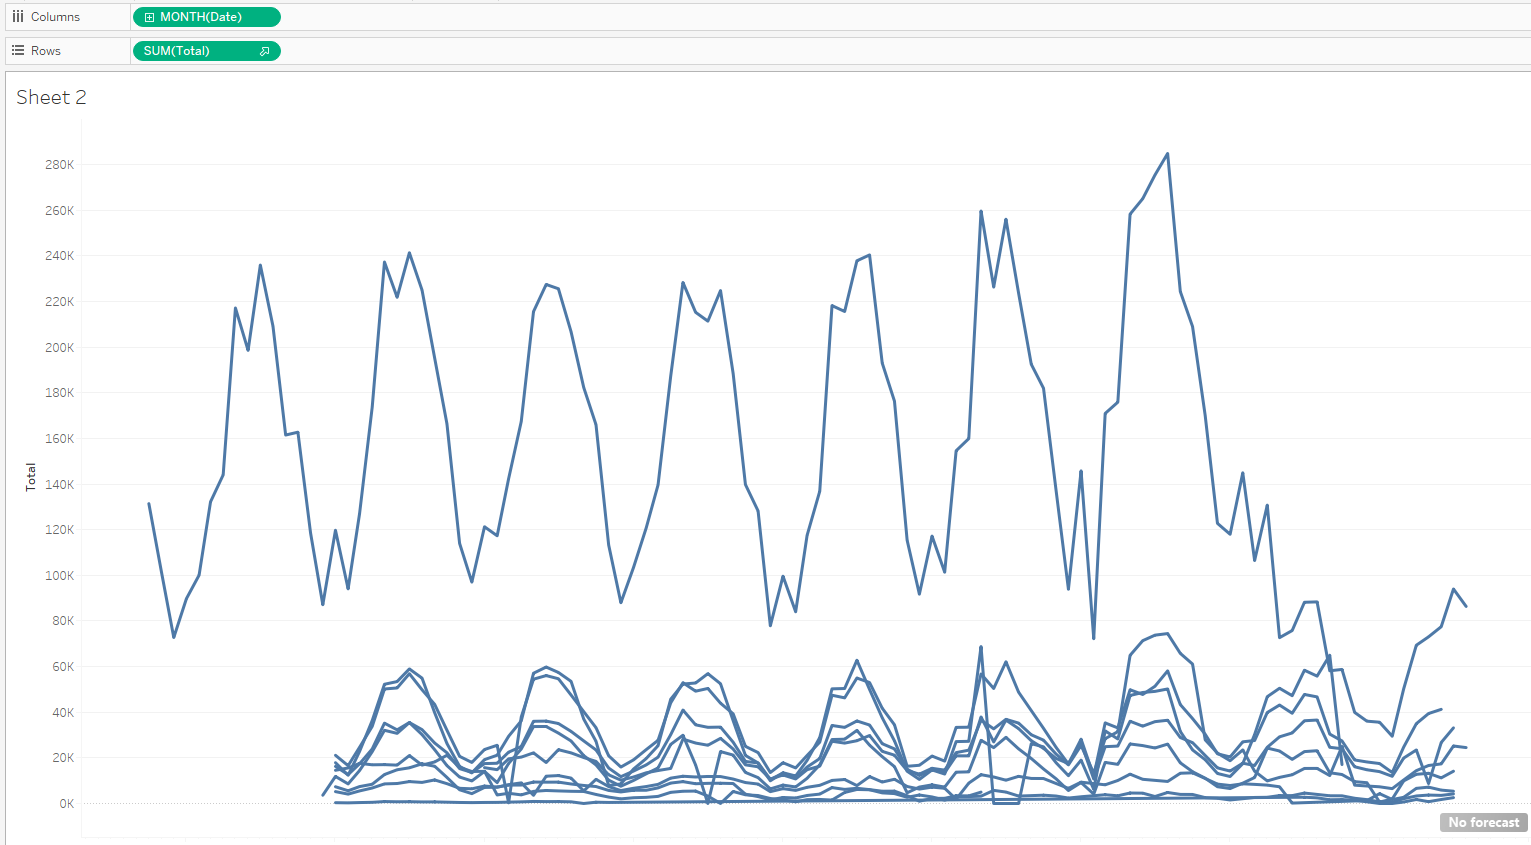
With 1.5hrs gone for data prep, I was ready for the visualization part. Load the hyper in Tableau and a moment of truth come...
Read documentation before start using API.
After all the data prep work down is done, I realized from the view, API has restricted the number of downloads to only 1000 results per API call. Throttle in the download tool doesn't help, as the documentation indicate we need an token for additional data access. And to register with an government ID is not exactly feasible. So back to square one with only 1.5hr to go.
Luckily the site does over csv download which include all the data, so we had to use that route instead.
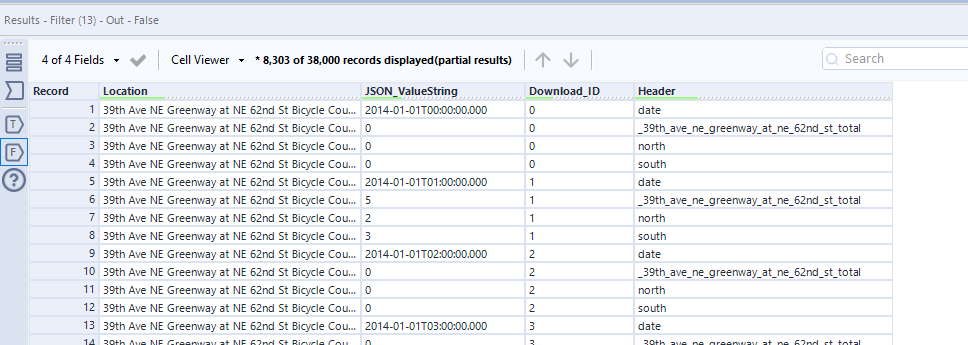
As I learnt additional lesson about data quality, not everyone is good at keep a consistent structure. Every single csv has different column names after parsing which make the job of union impossible. Rather than being fancy with any complicated parsing strategy, I choose the oldest way of doing it.
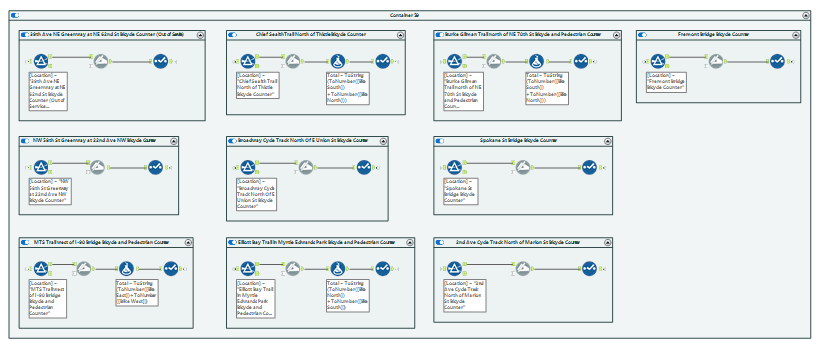
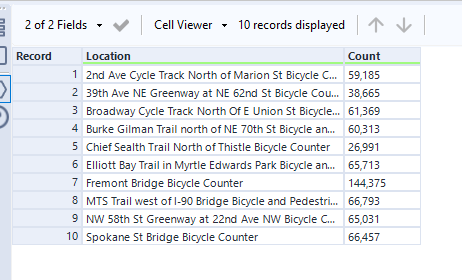
A bit of copy and paste involved, but it handles the data well, as some have pedestrian number and some don't. By handle each Location individually, I was able to calculate the correct bike count total and rename each field consistently for union.
Unfortunately due to the time constrain, I was not able to produce a dashboard.
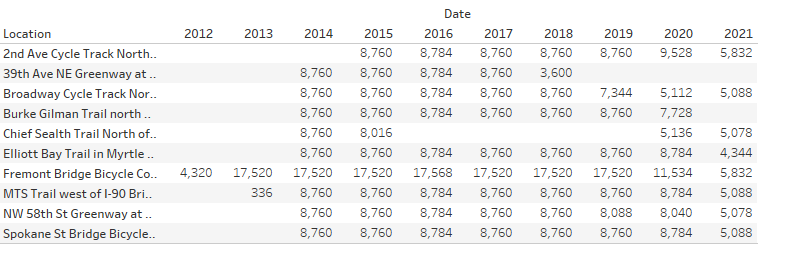
Note: Fremont Bridge is large than normal, again no time to investigate.
Slight a sad note for the final day of the dashboard week. As much as I learnt a lesson about using API's, it is rather disappointing not to be able to publish a dashboard on time.