


Questions: How to build a dynamic heatmap by using date level parameters such as, Year, Quarter, Month, and Weekday?
Answer: Create two parameters for the Column and Row on the worksheet.
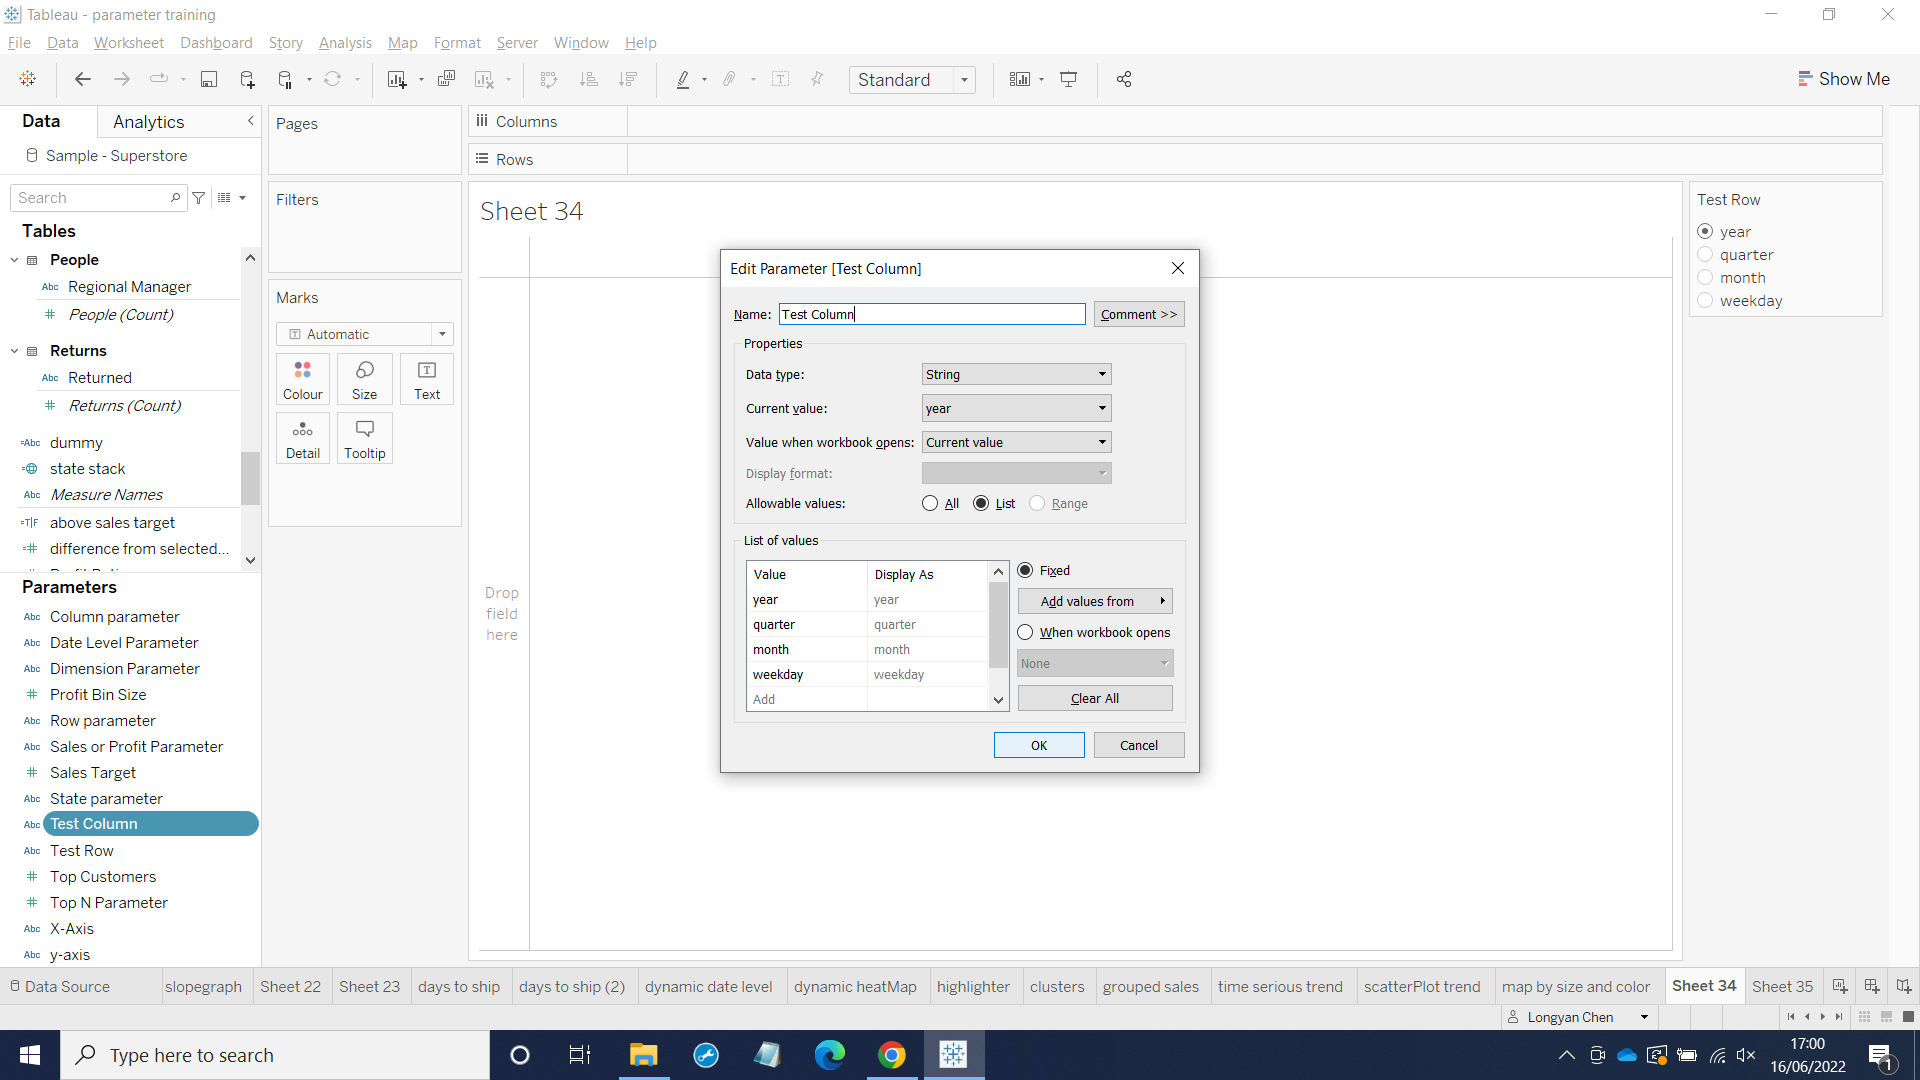
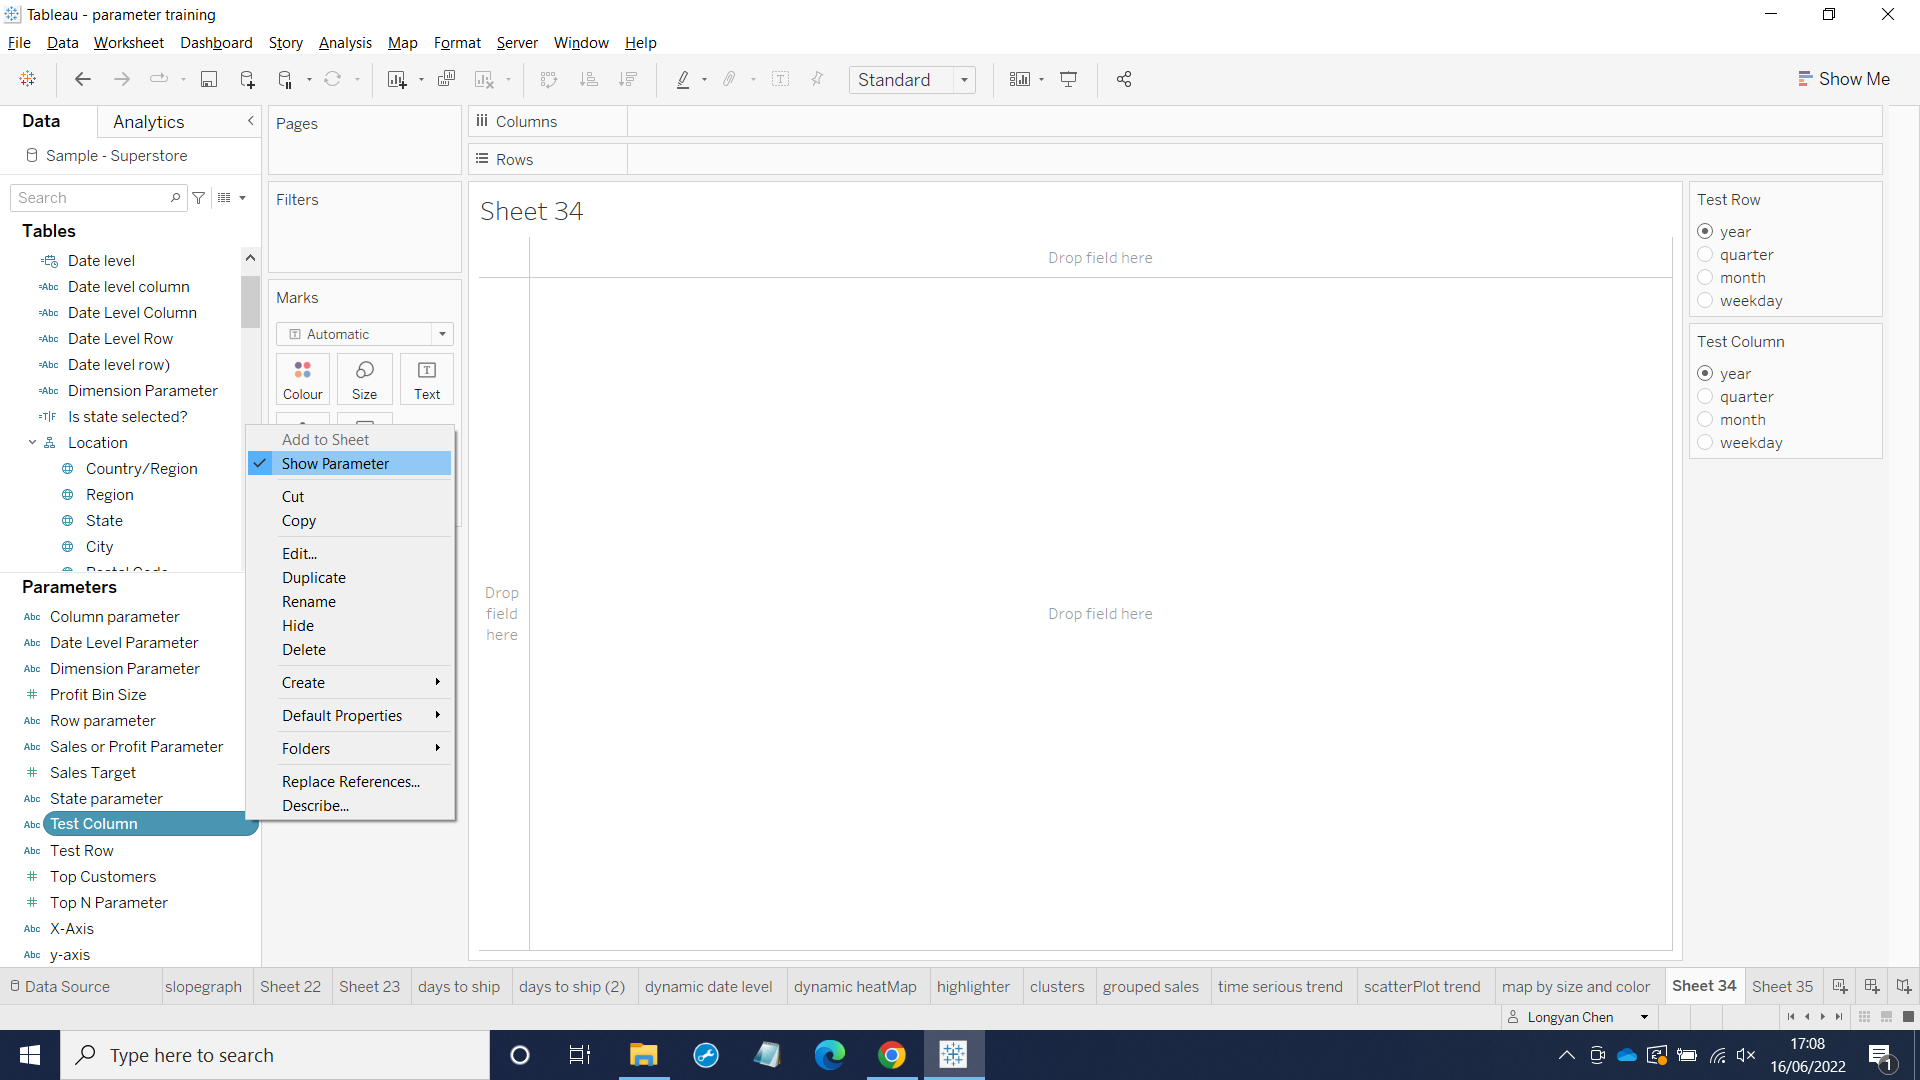
Create the first parameter which is named Test Column and repeat the method to make the second one and name it Test Row. Just make sure that first letter of date should be lower case in Value column, otherwise Tableau doesn't recognize them. Click the parameters and choose show parameter from the dropdown menu.
In order to make heatmap, dimensions are needed to be on the Column and Row. Values are needed to be dragged into Color within View Cards. In order to use date level parameters, calculation is needed.
Click to create calculation field and name it Date Level Row and repeat the same process to create Date Level Column.

Once everything is ready. Start to build a heatmap. Drag Date Level Row and Date Level Column into Columns and Rows. Put profit into Color that is on the View Cards.

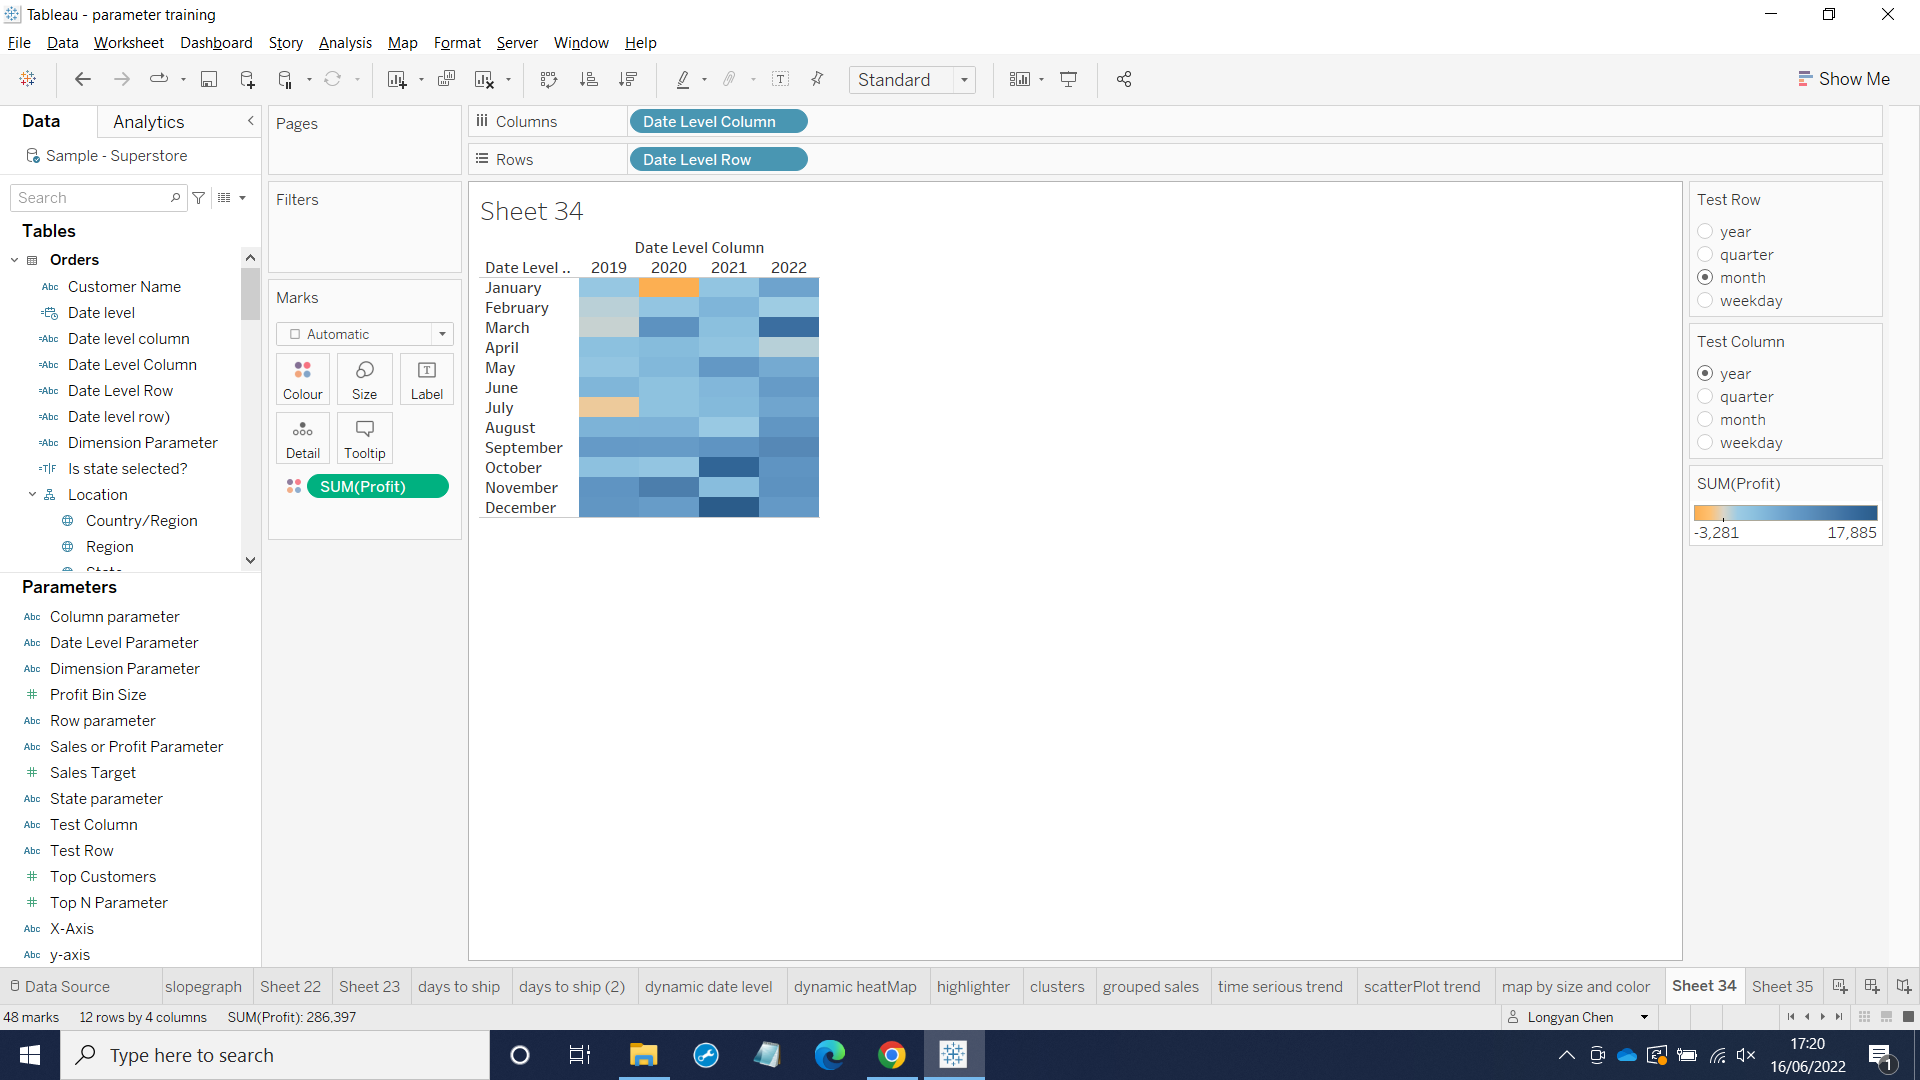
Now the dynamic heatmap is done.