


What is the difference between discrete and continuous data in Tableau?
Discrete data are counted as separate and distinct values. They have clear space between two values. You can only take specific values. For example, how many chairs are in the room? How many students are there in the classroom? How many provinces does China have?
Continuous data are used to measure a value and they have unbroken part as a whole. You can take on an value in an interval, such as, our height, weight and the car speed.
Now let's see how it looks within Tableau:
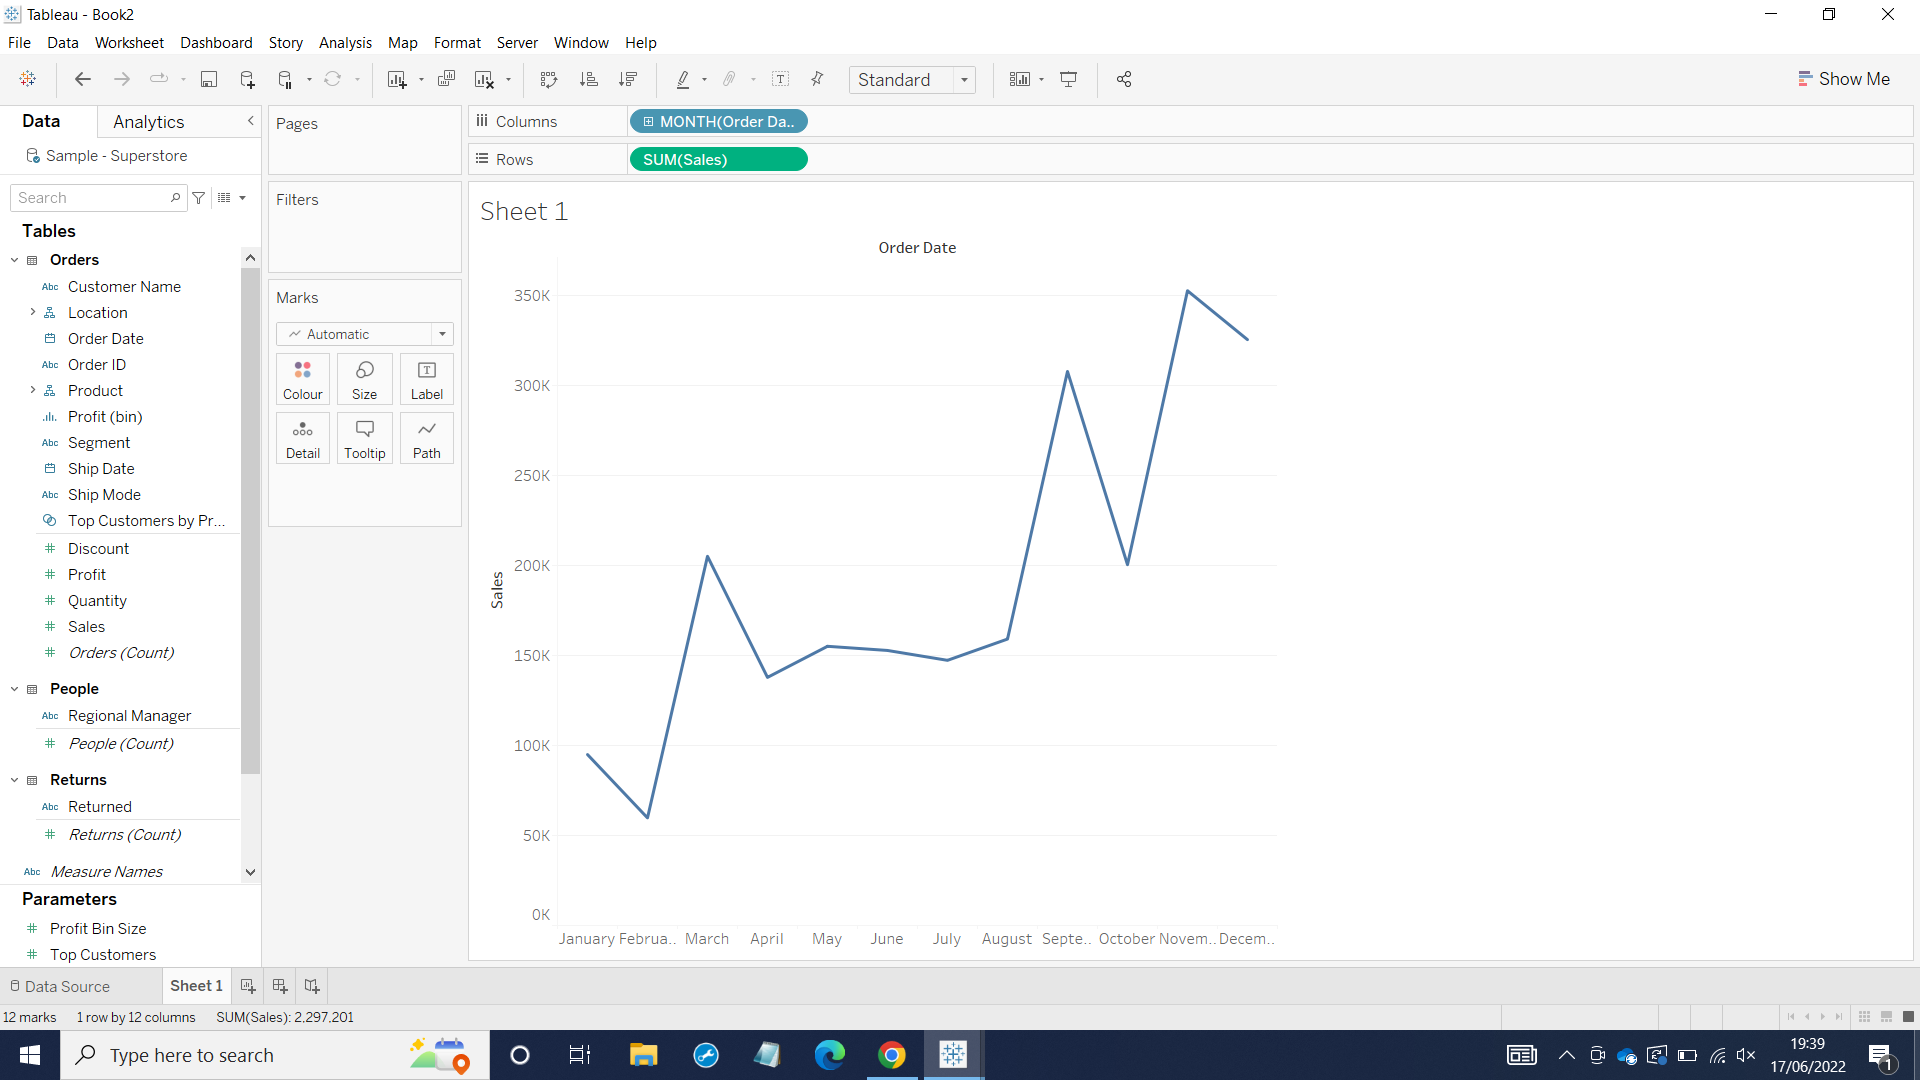
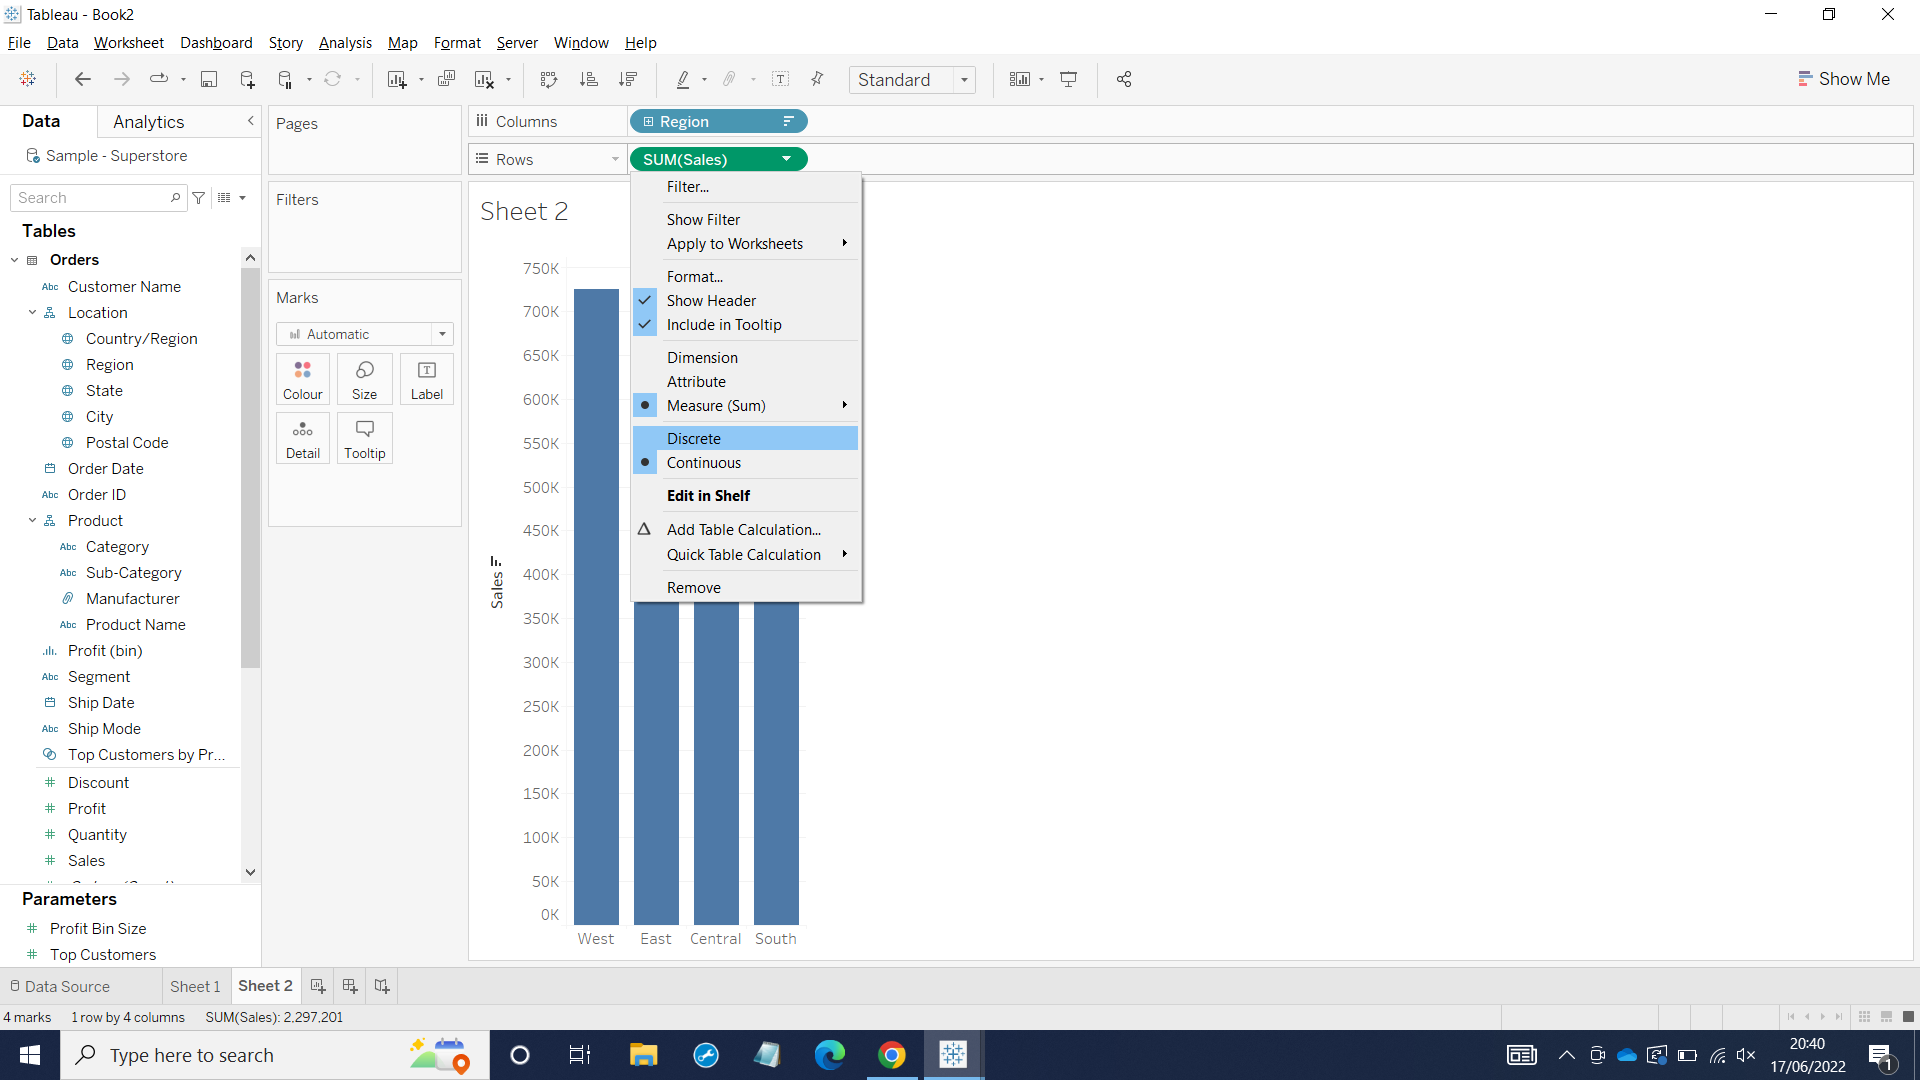
In the Data Pane, you will see blue and green icon on the left hand side. The blue icon is dimension and the green is measure. Generally, dimension indicates the data is discrete such as ship mode, customer ID, and region. Measure indicates the data is continuous such as profit, sales, and discount. In the worksheet, you can see the month is colored blue, which means it is discrete and it creates 12 separate value from January to December. Sales is colored green and it creates Axis value.
If you want to convert the month into continuous data, first you need to click the Month drop-down arrow.
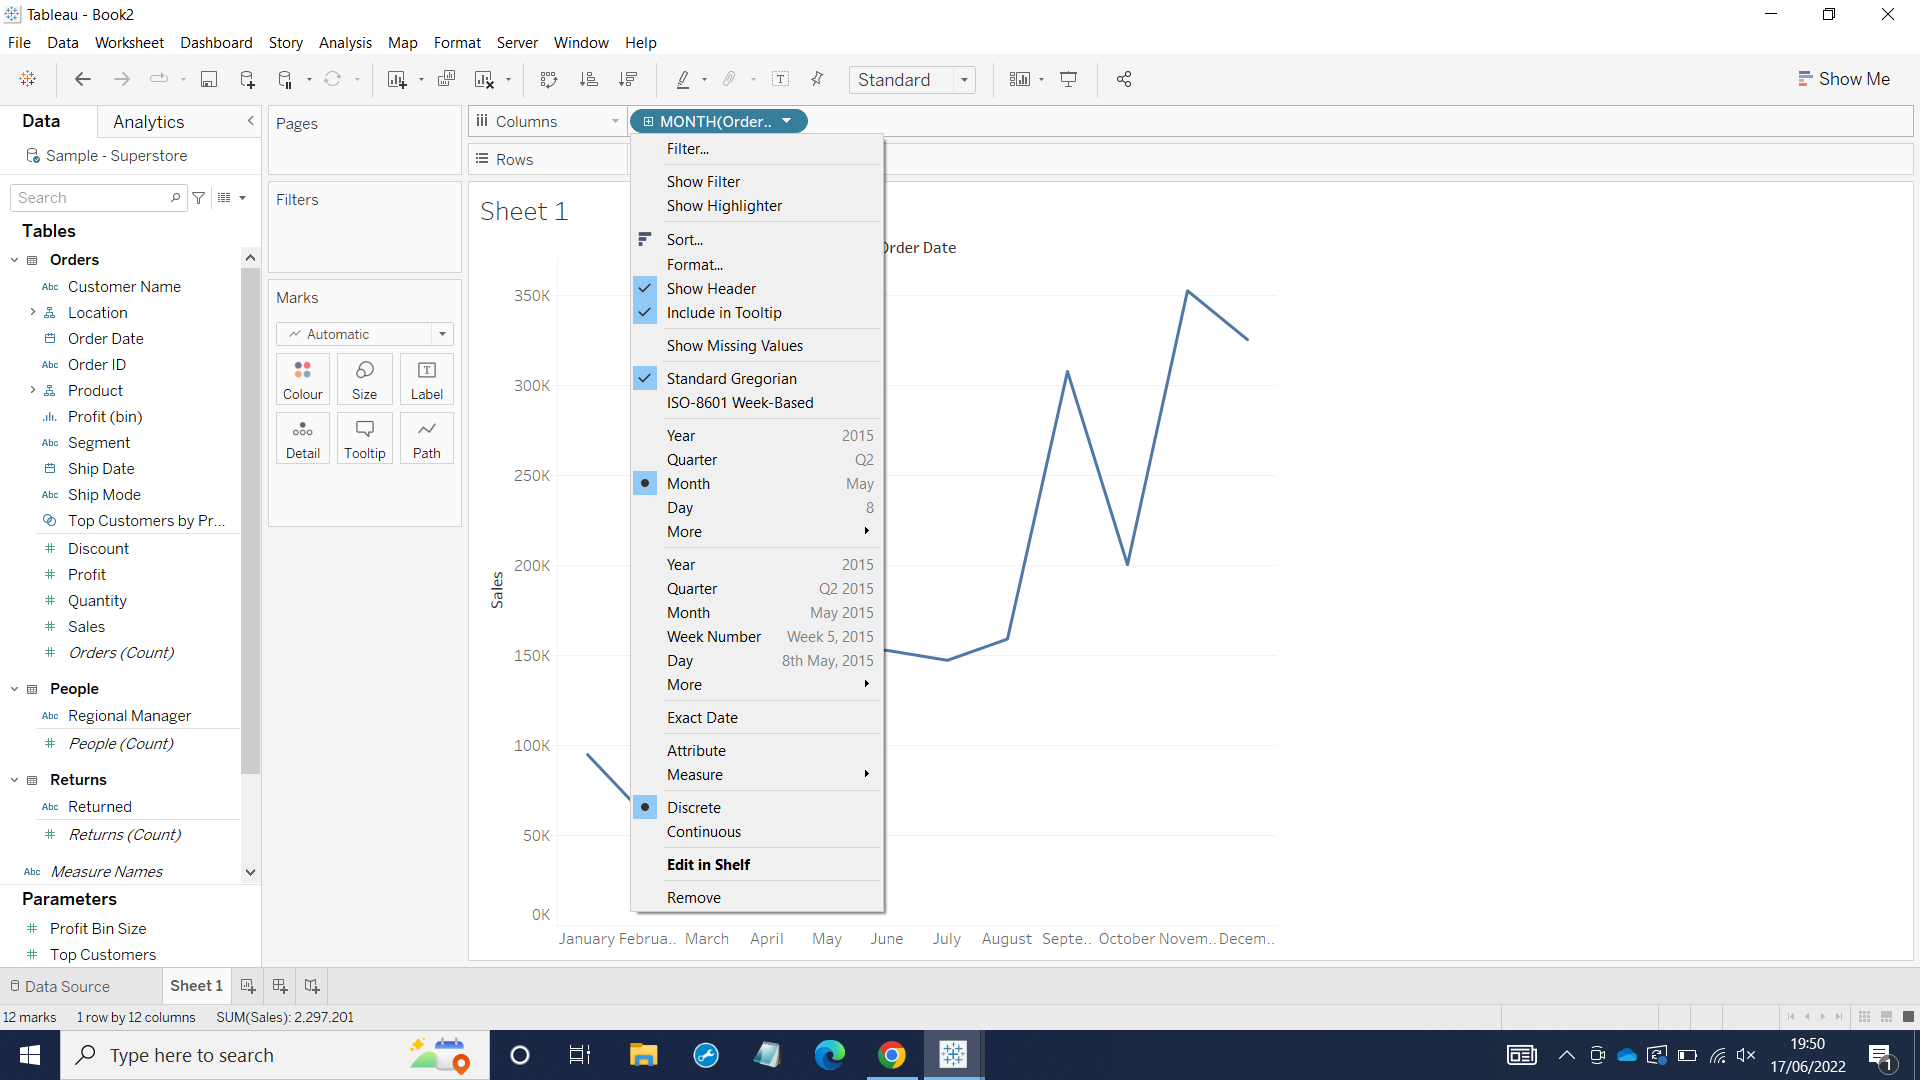
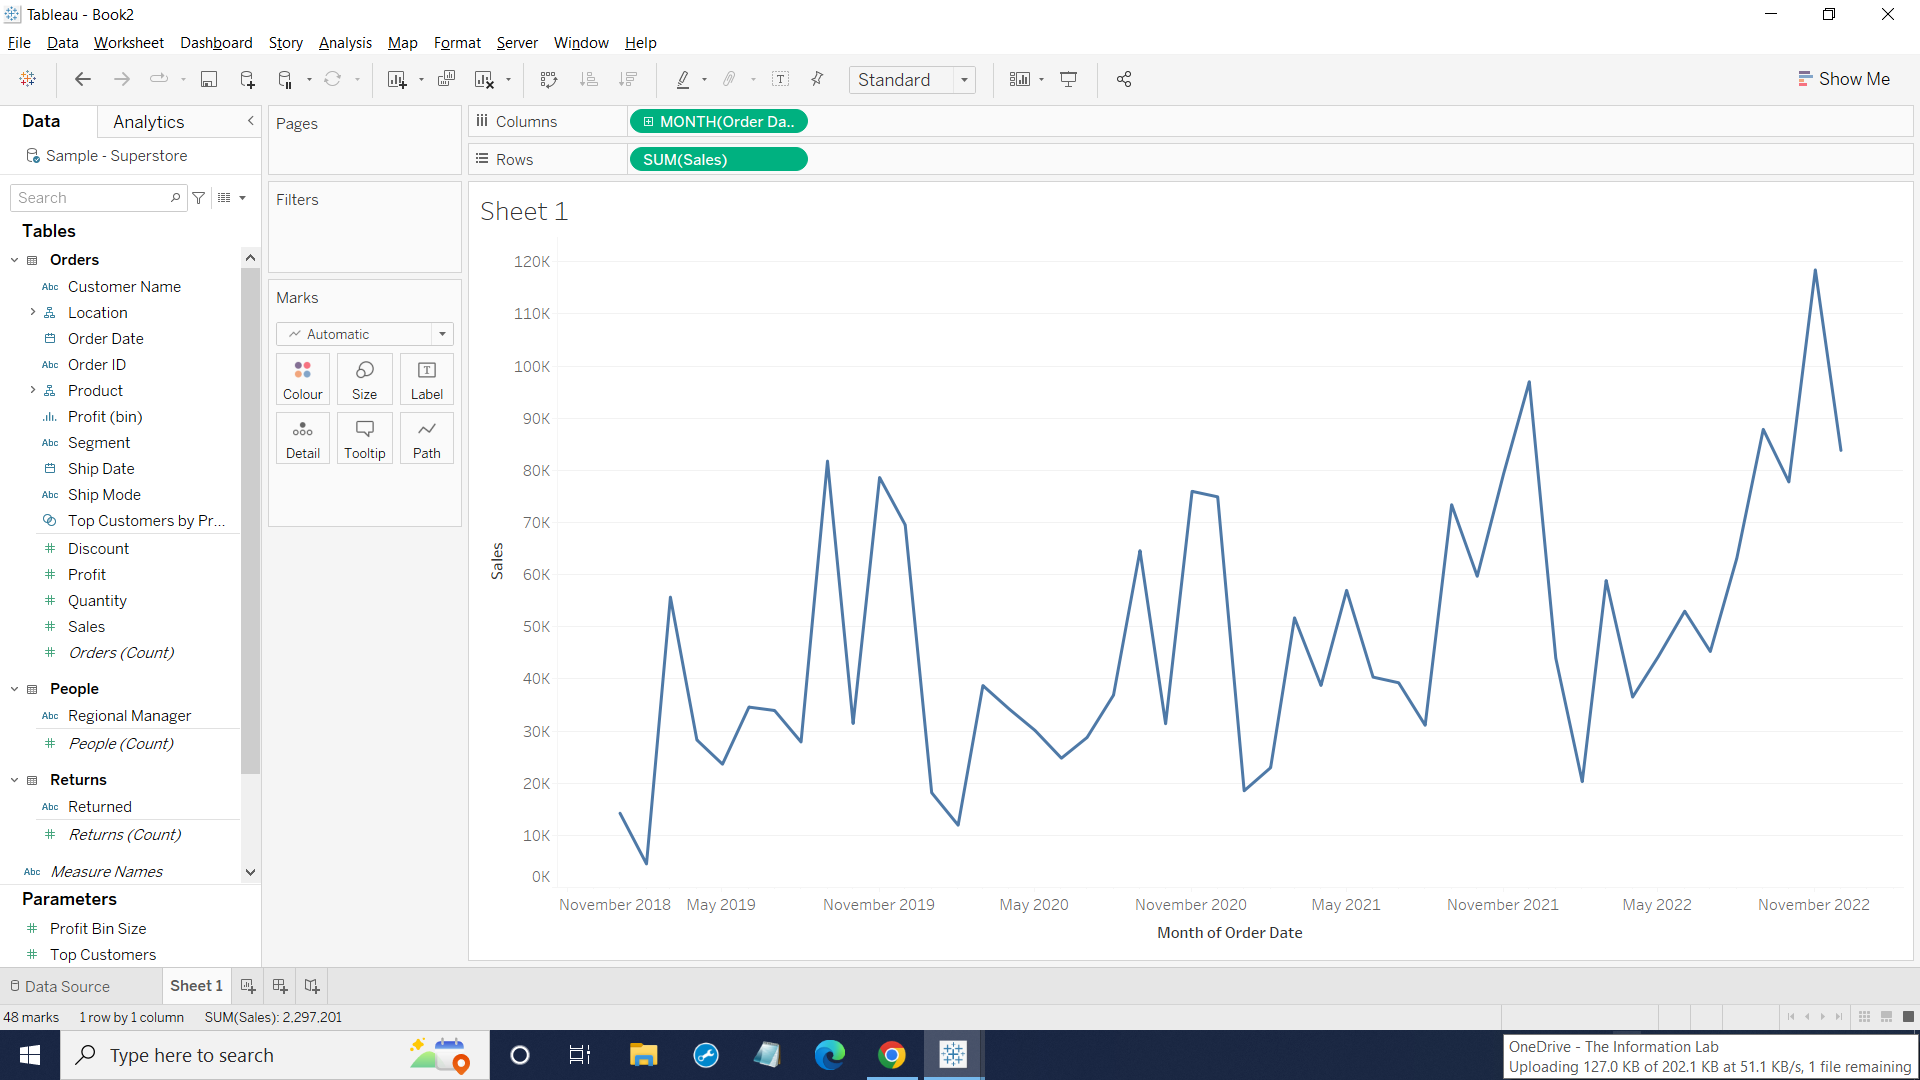
Then, you choose the second Month May 2015 instead the first Month May on the top. It will turn into continuous month from the beginning to the end as a whole period of time as below:
Hopefully, now you have some ideas about how discrete and continuous data works in Tableau. Next, I will show how to convert from continuous data into discrete data.
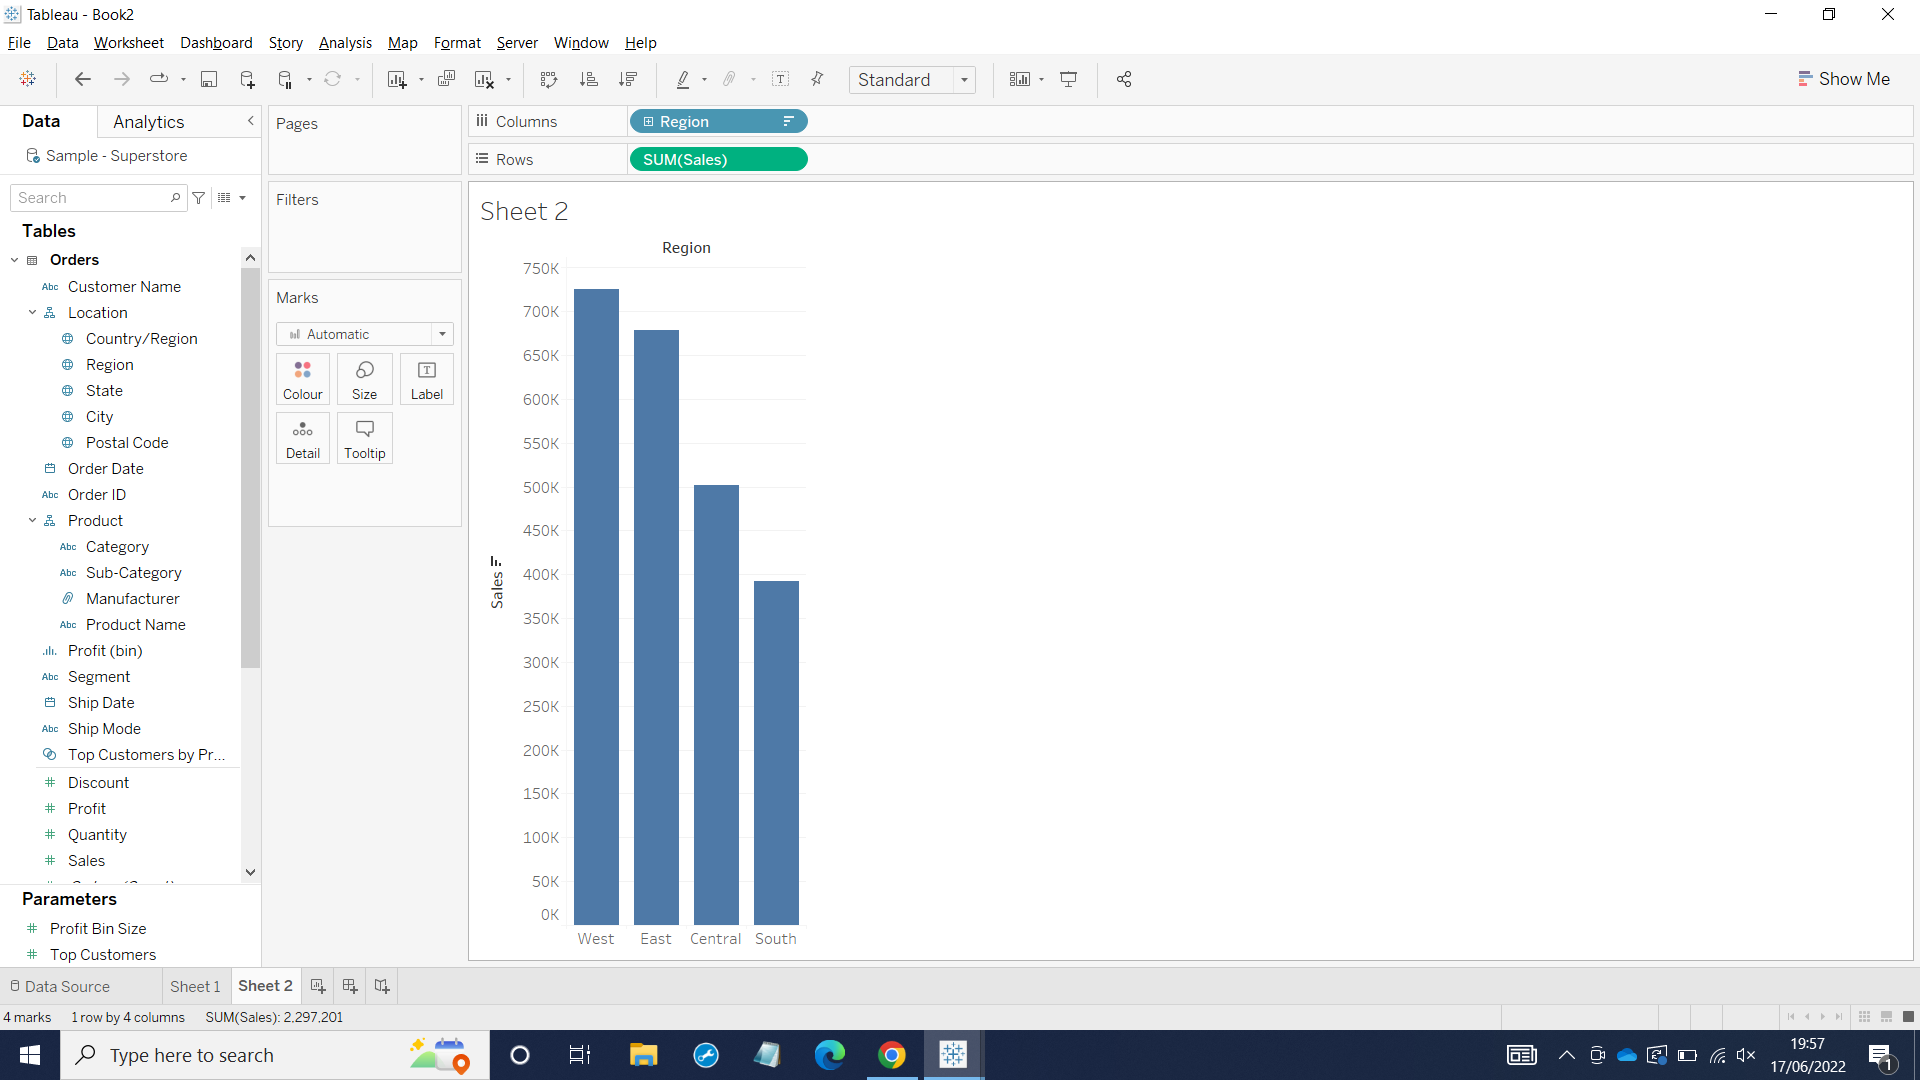
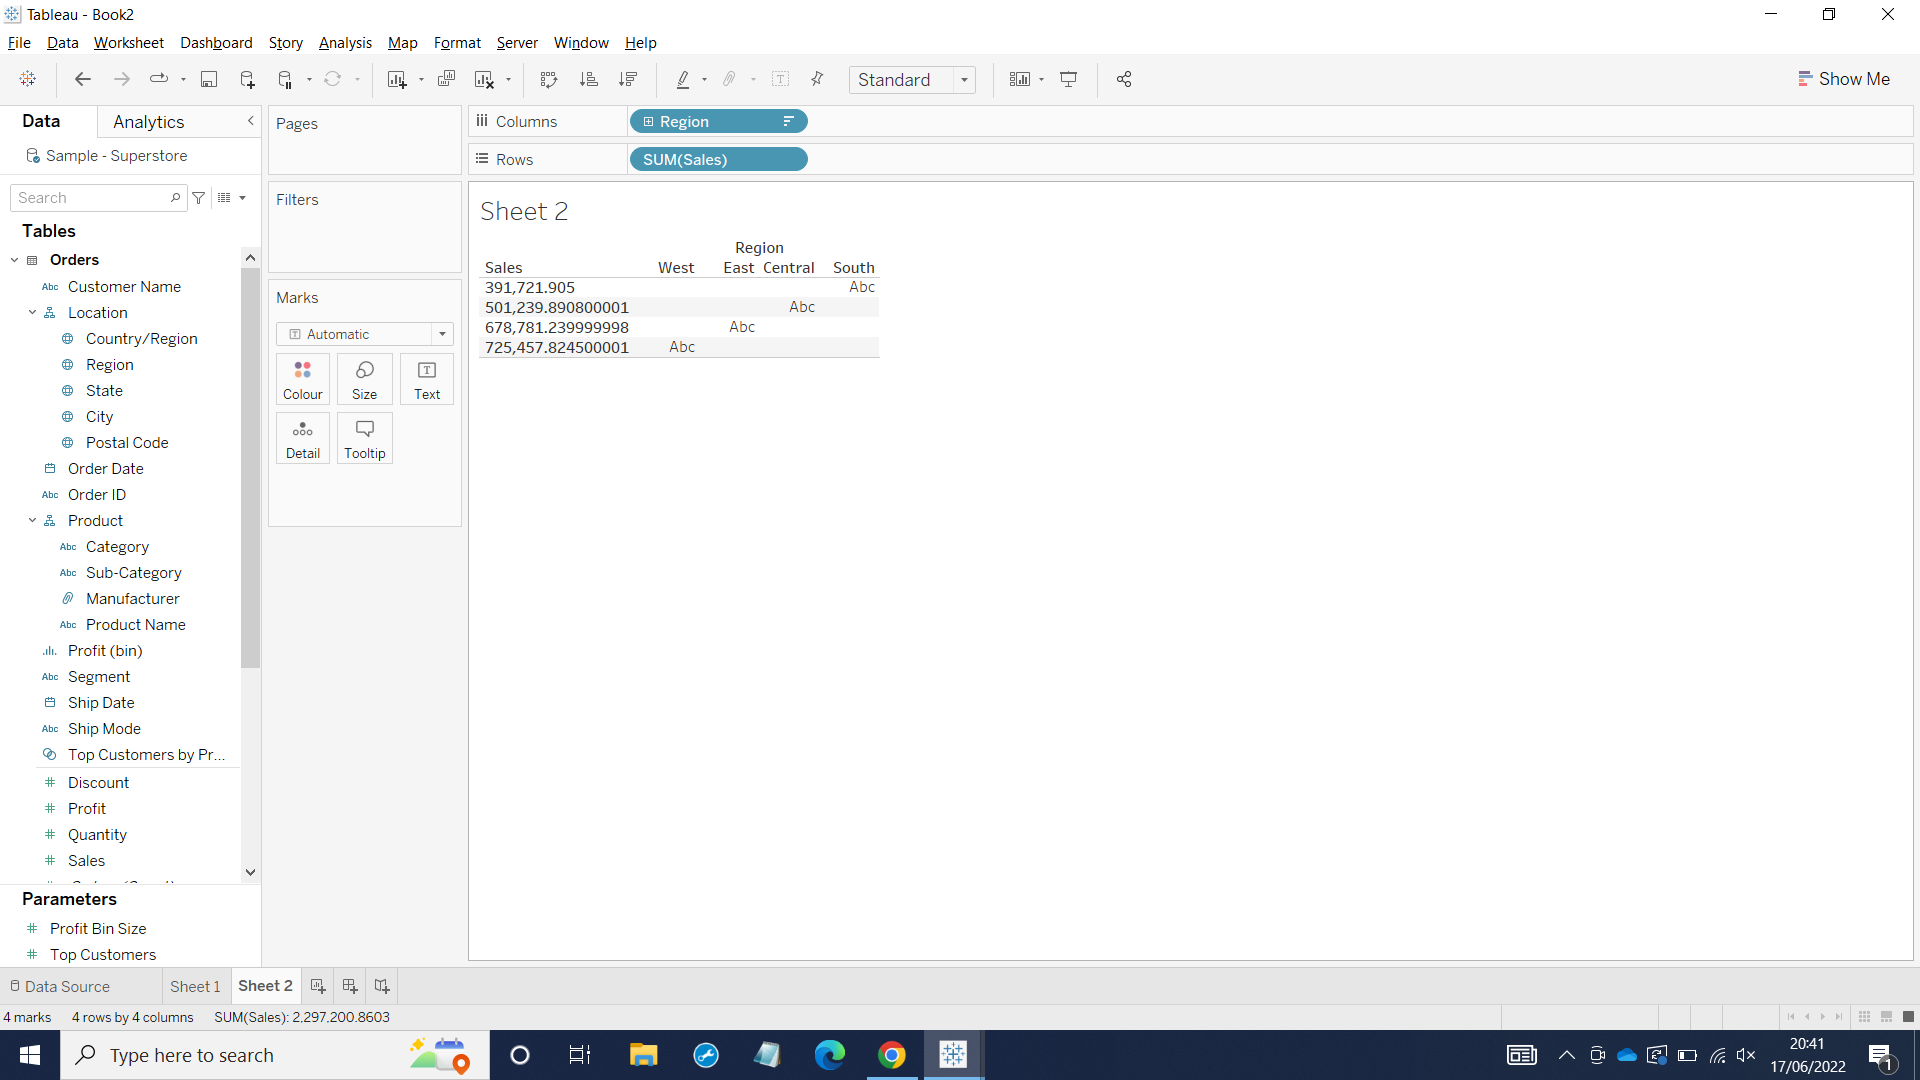
Now as we can see, the blue coloring SUM(Sales) gives us specific value for each region.