


The Brief
The first day of dashboard week was all about building a dashboard from web-scraping data. We were each tasked with choosing a continent and scraping it's corresponding data off of the "Backpacker Index" website.
The dashboard to build on the back of this data was up to us.
 Roger Wade
Approach and Process
My first thought was to scrape the data using Google Sheets instead of Alteryx - using the IMPORTHTML function. After trialing it out I realised that due to the format Google Sheets pastes the data in, I would have to clean it religiously in Alteryx anyway. Doing the original web-scraping in the same flow as my data cleaning would be much more helpful.
For me, the biggest challenge with web-scraping was by far understanding RegEx. The morning was spent with a lot of trial and error, trying to figure out what expression would return the data I needed. Eventually, I had to de-scope the output for the dashboard as I spent too long on the actual data extraction.
I found that there was no overlying section in the HTML that encompassed both the city names and their statistics (apart from the entire code). In order to not pull in the data for the whole web page, I ended up doing two different RegEx calls.
After web-scraping the data, came the arduous process of cleaning it. My process of cleaning it wasn't the most efficient or flashy, but my workflow ended up looking like this:
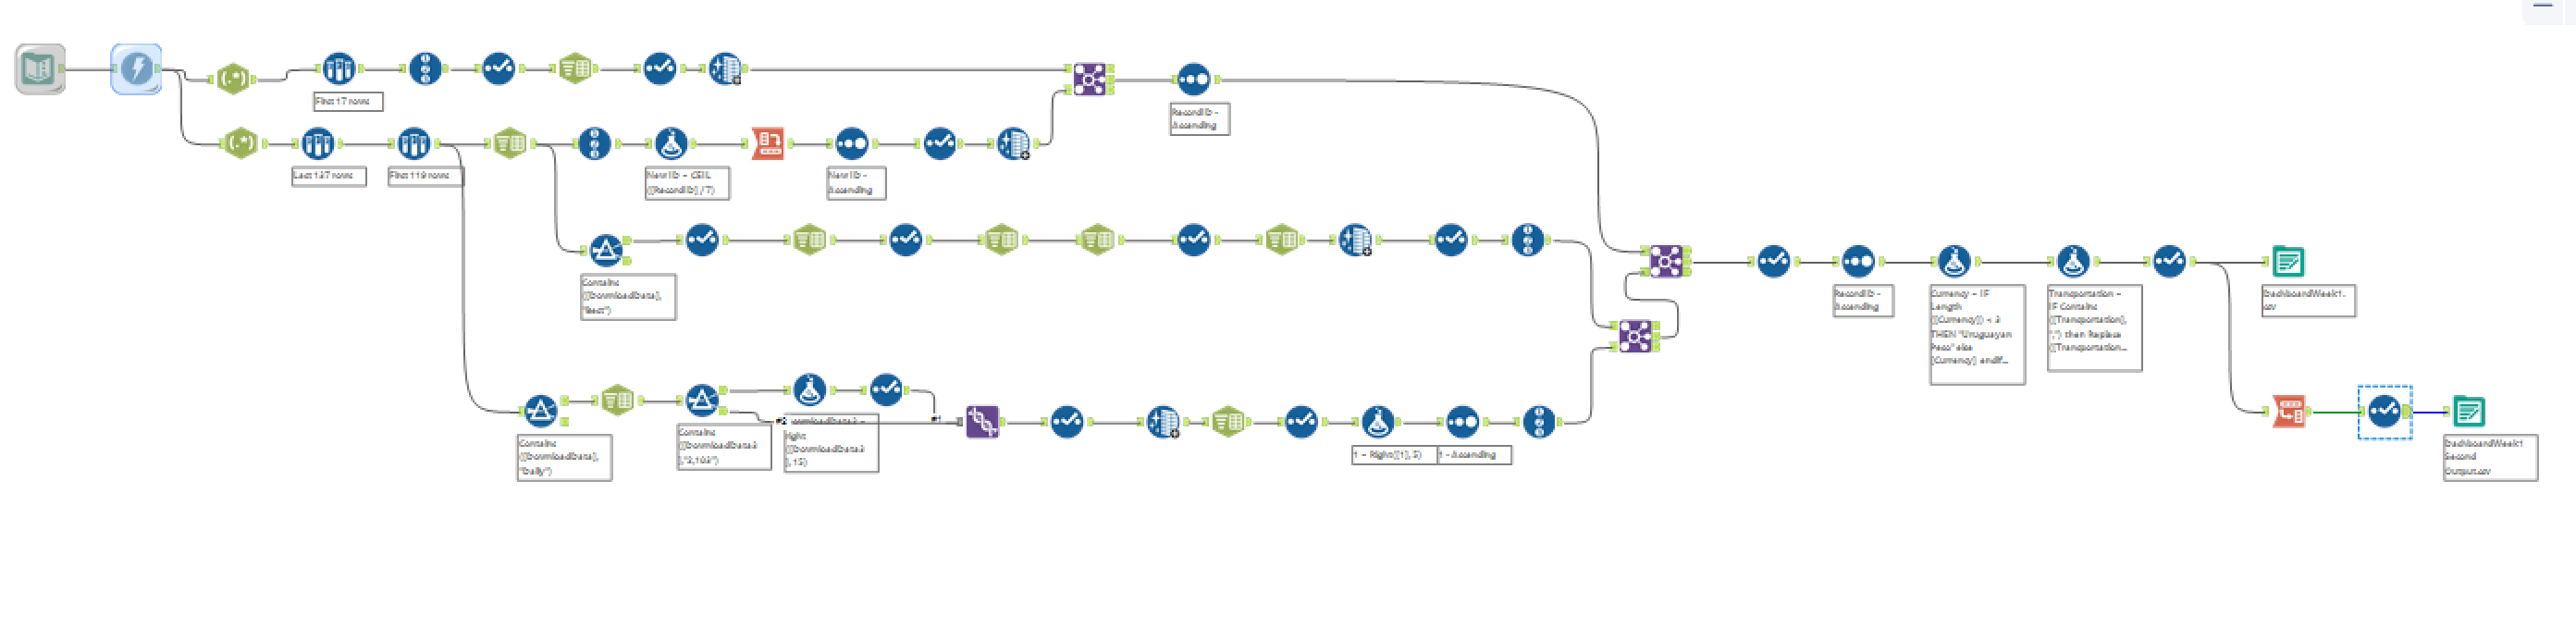
I ended up producing two outputs. This is because I made a bump chart - which needed a specific column to be pivoted in order to be made. However, it was necessary this column remained in it's original format for the other charts.
After the cleaning was done, it was time to get building in Tableau.
Data Visualisation
After spending the morning on the data extraction and cleaning, I spent the remaining 2 hours on building out the dashboard.
The idea was that you could click on a point in the map and the colour would change for the other charts, highlighting the specific city that was selected.
One thing to note is that there is pretty much a different currency for most of the South American countries, meaning I had values of 6 and 15,000 which technically didn't differ that much in value. In order to standardise this I converted everything into USD, as some South American countries actually use USD as their currency.
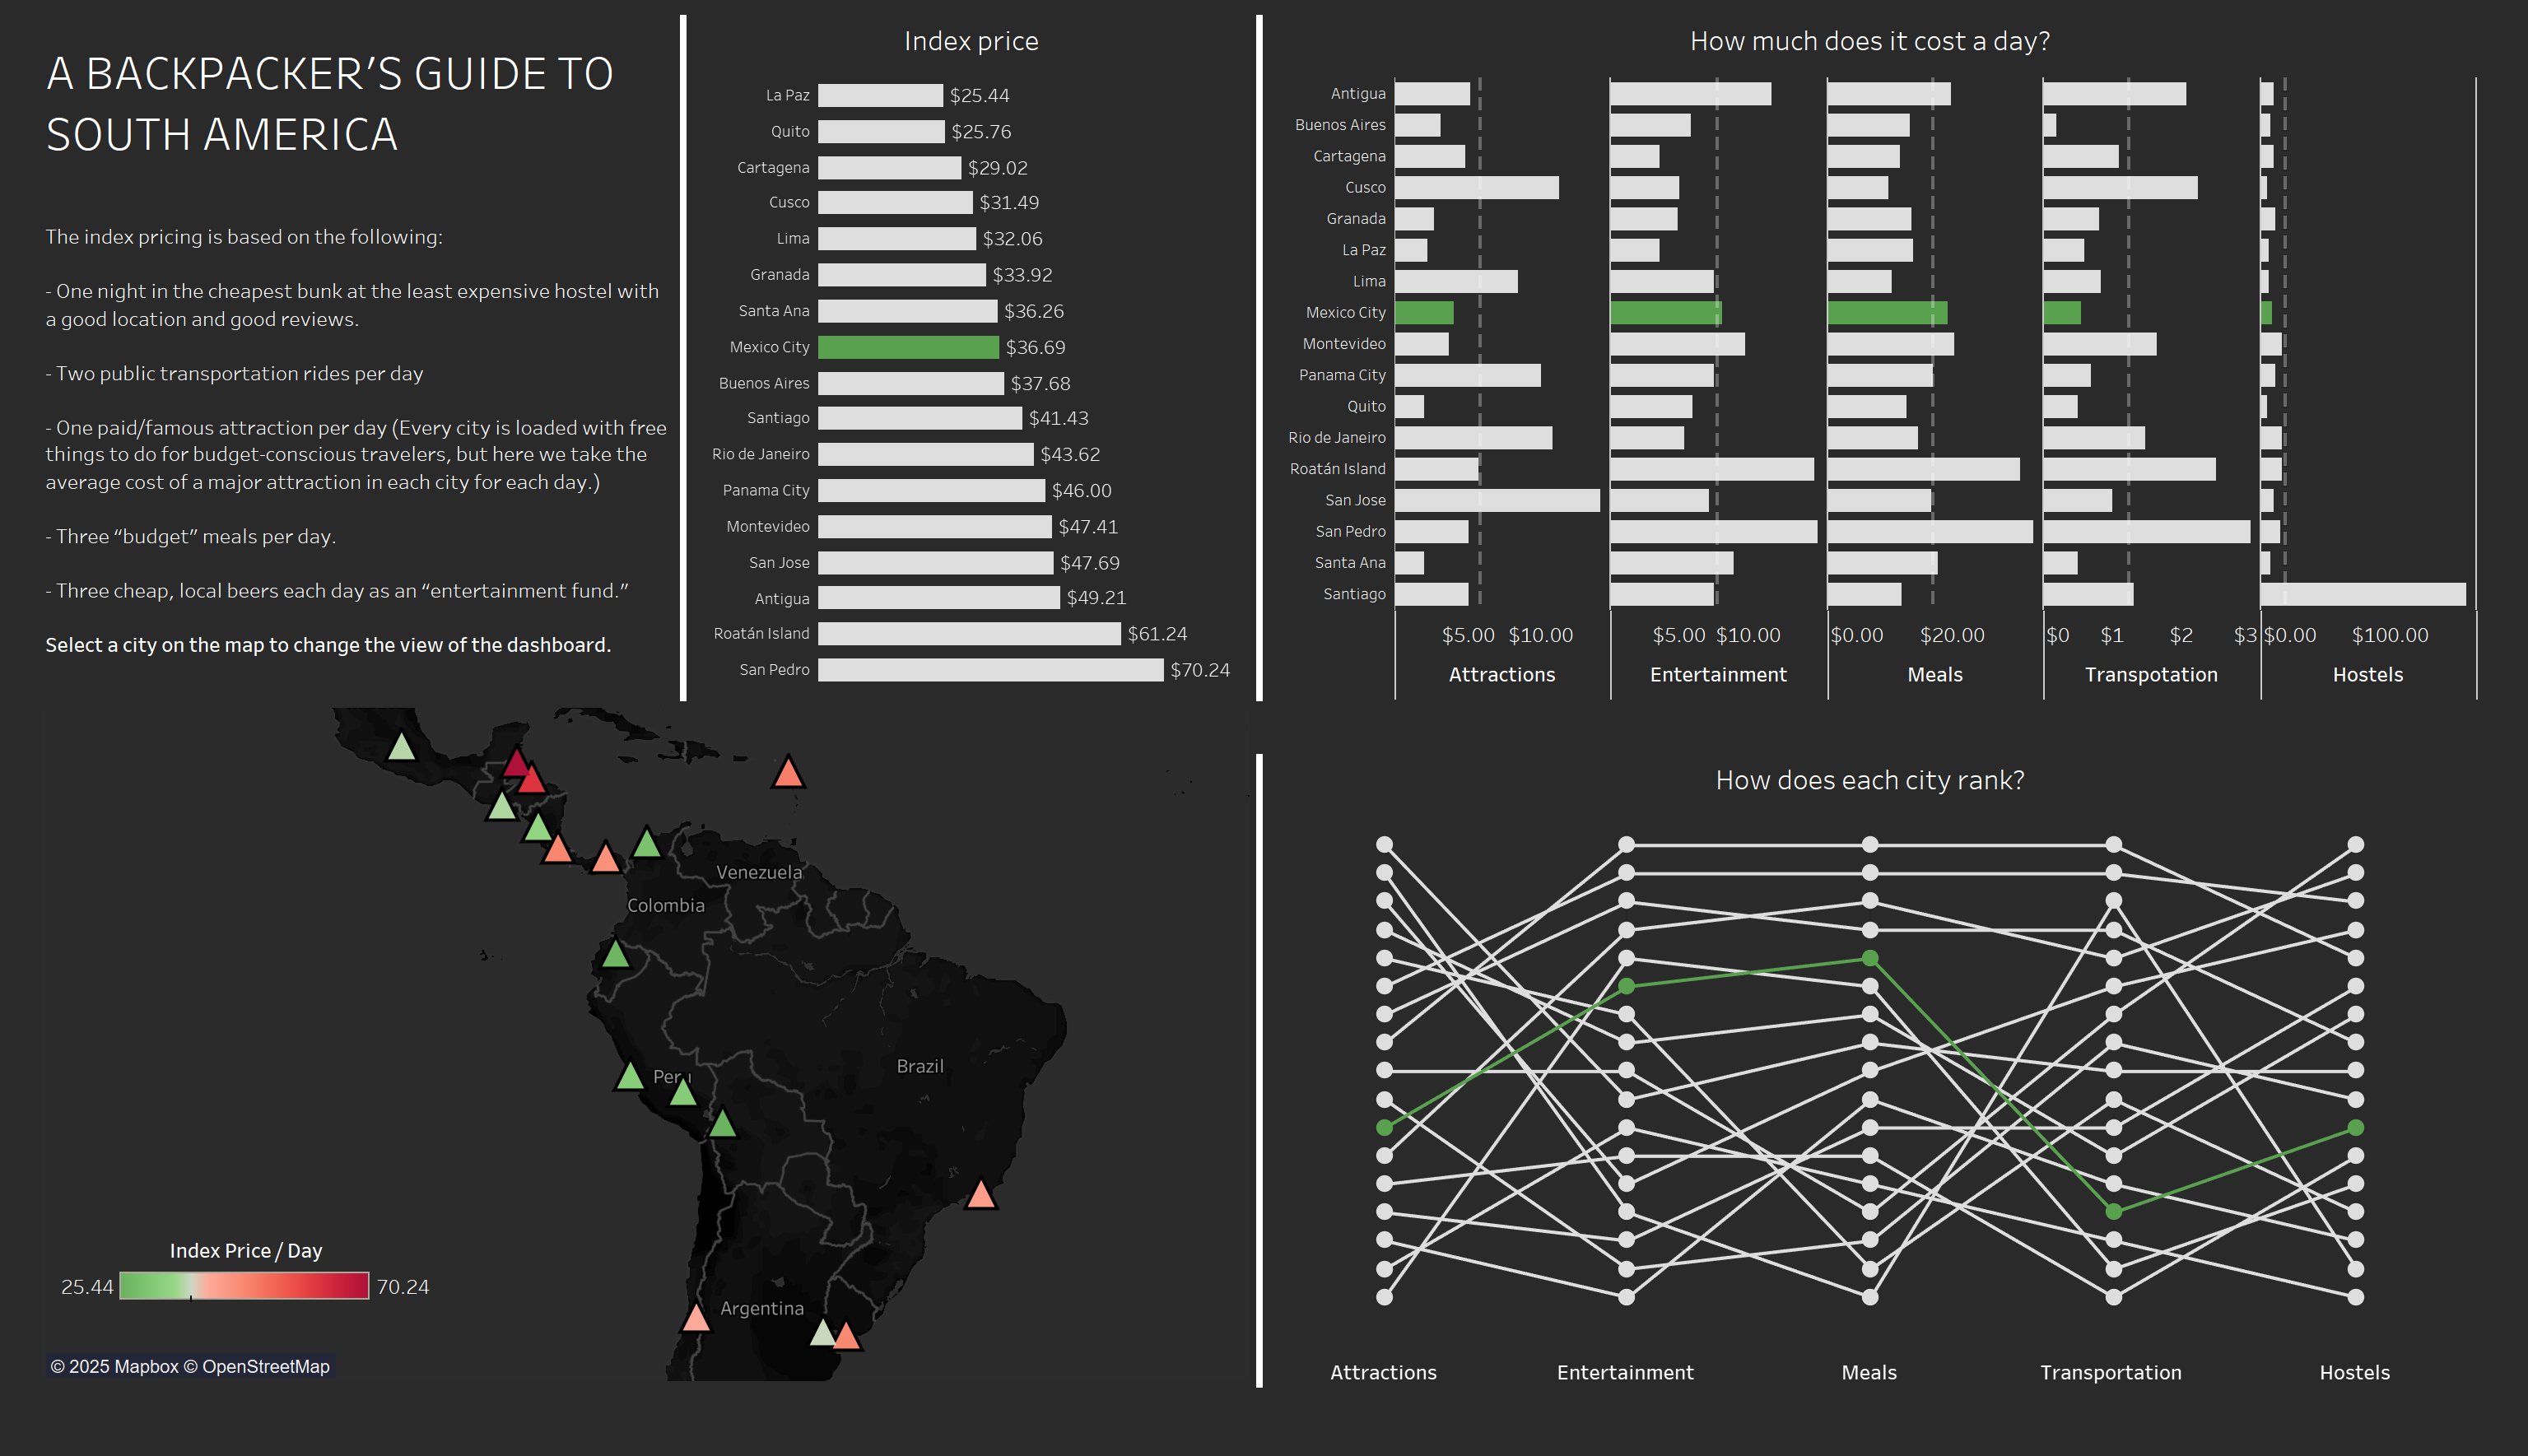
https://public.tableau.com/app/profile/louis.phipps/viz/ABackpackersGuidetoSouthAmerica/Dashboard1
Overall I'm happy with the outcome of the project, and am glad I was able to get it all done in a morning / afternoon!