When to use a hexbin map?
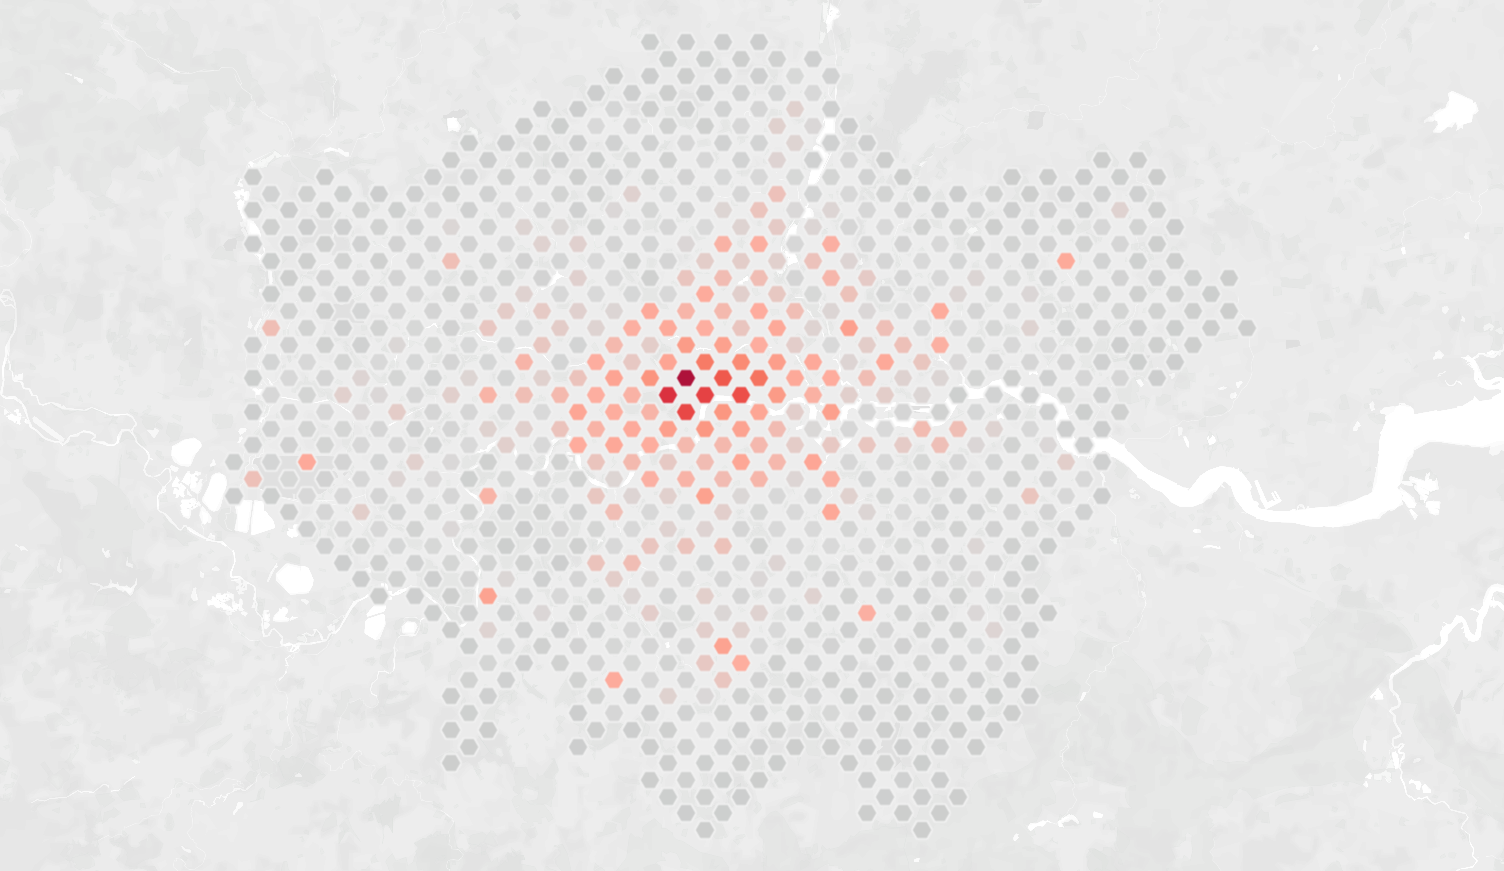
Hexbin maps are particularly insightful when you have a high density of data points that overlap with each other on a map. You could use a density map, but you won't be able to see the values for each data point. Hexbin maps will map your data into their closest hexagonal bins and outline the data points that fall within them.
Also they are way better looking in my opinion.
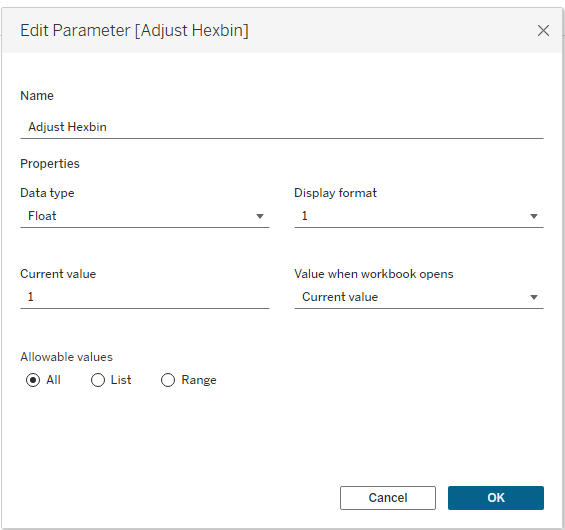
Step 1 - Create a parameter
When you map hexbins, the bins will have a side length of "1". If you do not have a parameter that can scale this appropriately then you will only have a single data point on your map. A parameter will help you increase/decrease the number of hexbins you see on your map.
Note: The larger the scale of your map (e.g. map of US), the smaller your parameter value will need to be to get the same number of hexbins on a smaller map (e.g. map of Manhattan).
Step 2 - Create your calculated fields
You will need two calculated fields, one for your X co-ordinate and one for your Y co-ordinate. For this we are going to need the XBINX & XBINY formulas, which:
"Maps an (x,y) co-ordinate to the x/y co-ordinate of the nearest hexagonal bin. The bins have a side length 1, so the inputs may need to be scaled appropriately"
Your two formulas should look like this:
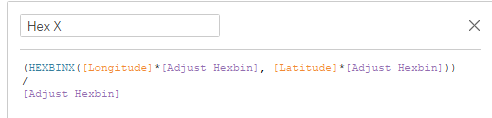
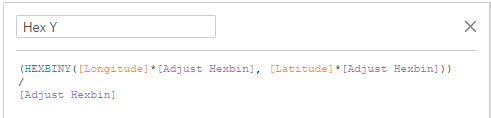
We times the longitude and latitude by our parameter just so we can get the parameter linked to our calc. We then divide by the parameter to get our original longitude and latitude values.
You must ensure your Hex X calc is set to the geographical role of longitude and your Hex Y calc to latitude.
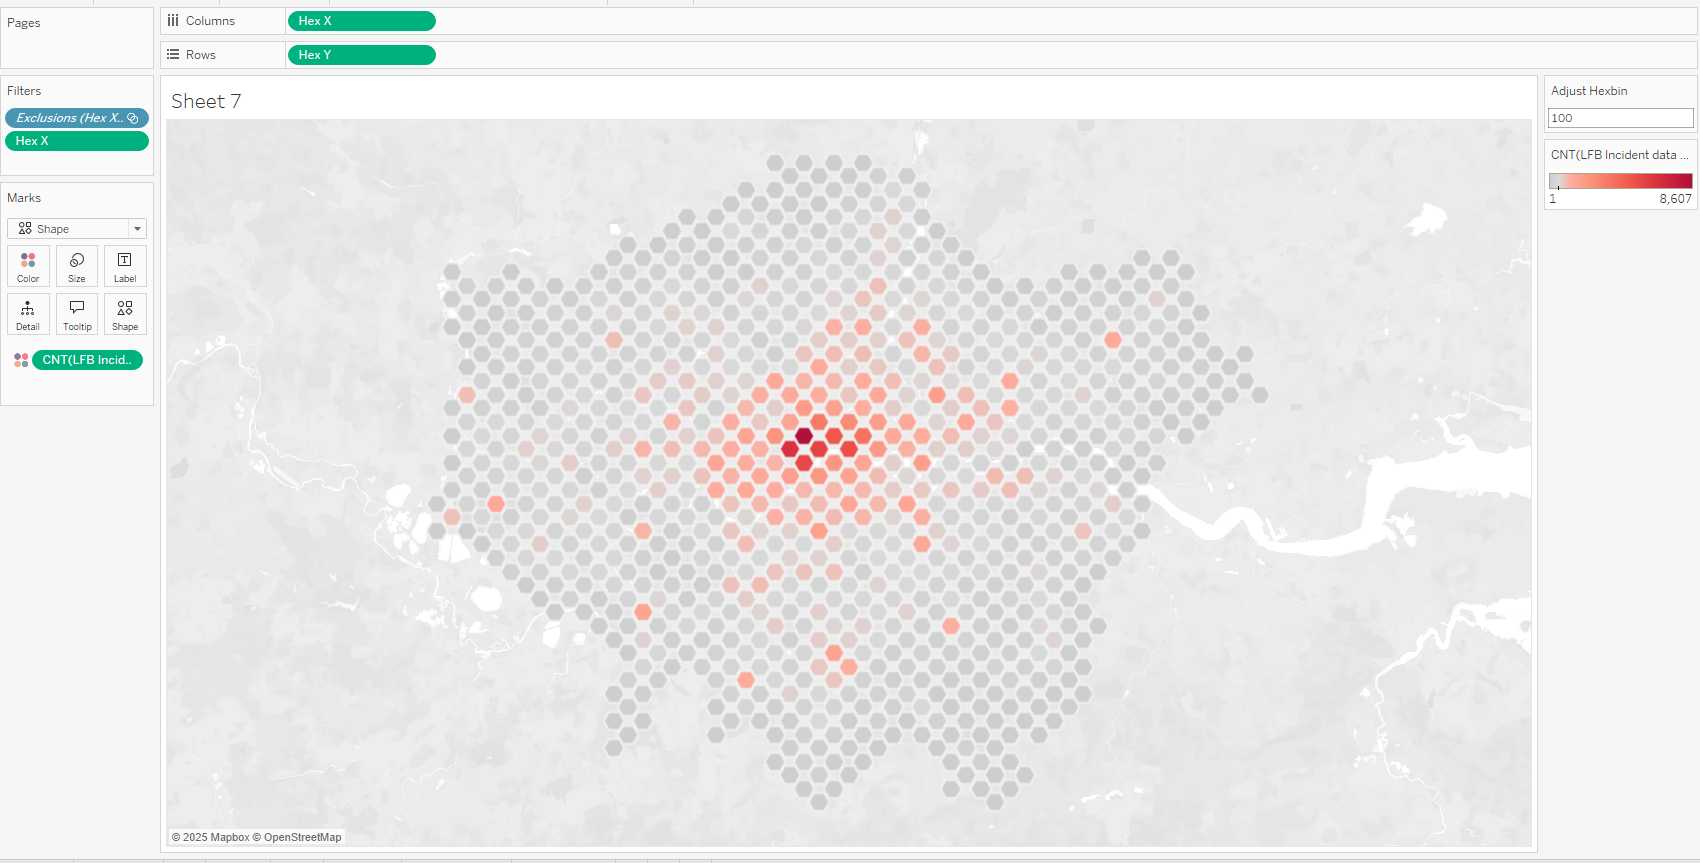
Step 3 - Map your graph
- Drag your Hex X calc into columns and your Hex Y calc into rows.
- Change your parameter value (if you only have 1 data point showing up it's probably because your parameter is set to 1)
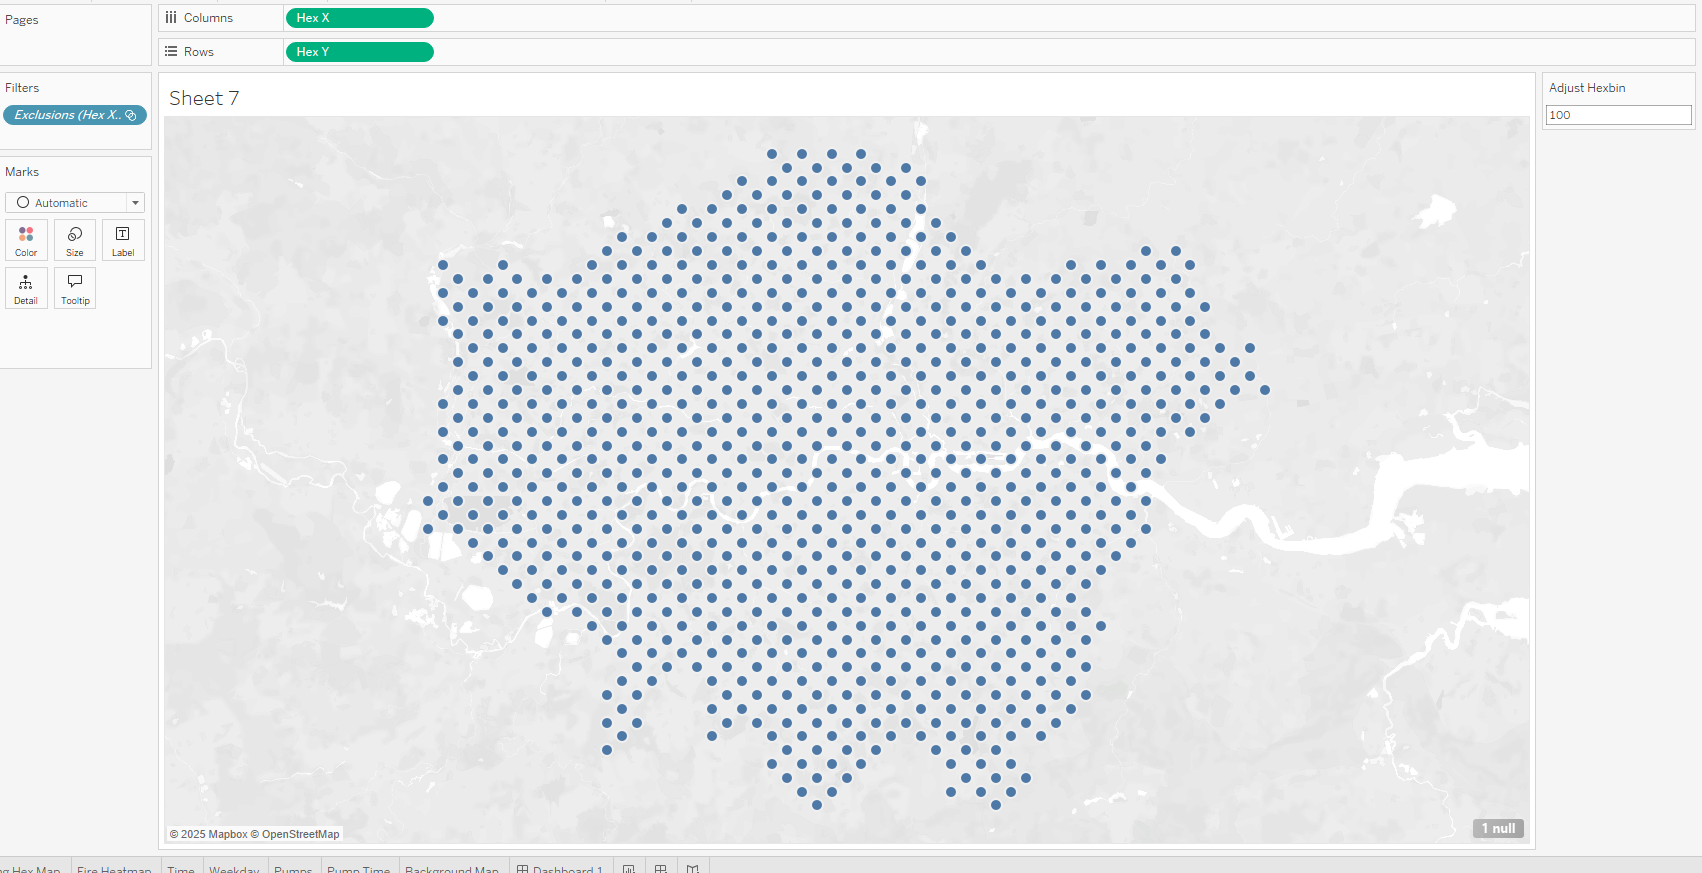
- Change your marks type to "shape", and change your shape to a hexagon.
- Hexagons aren't part of the Tableau default shapes so you're going to have to import a custom shape.
- Add a continuous field onto colour - in my case it was count of reported fire incidents.
- Adjust the size of your hexbins to preference.