


What is a Metric and how do we create them?
In Tableau Next, a metric is a KPI-style visualisation designed to track a single quantitative value over time.
A metric will typically show one single value, often with context-like comparison such as trend over time.
Just like KPIs, metrics are useful for monitoring key business numbers such as revenue, customer count, or conversion rates.
For Tableau Cloud users, Metrics in Tableau Next are very similar to Tableau Pulse, they both function on the proactive monitoring of key business KPIs over time. Users can also subscribe to metrics in Tableau Next just like they can get smart alerts via Slack, email and Teams in Tableau Pulse.
In order to create a metric in Tableau Next, you must be within a semantic model. When located within your semantic model, you will see a button that says "Edit" in the top right corner. Once you have pressed the edit button, a button dropdown called "New" will appear in the "model" pane on the left.
This dropdown contains all definitions that you are able to create within your semantic model: Metrics, Calculated Fields, Parameters, Logical Views, and Data Objects.
Select "Metric".
There are 3 steps in creating a new metric:
- Details
- Value
- Insights
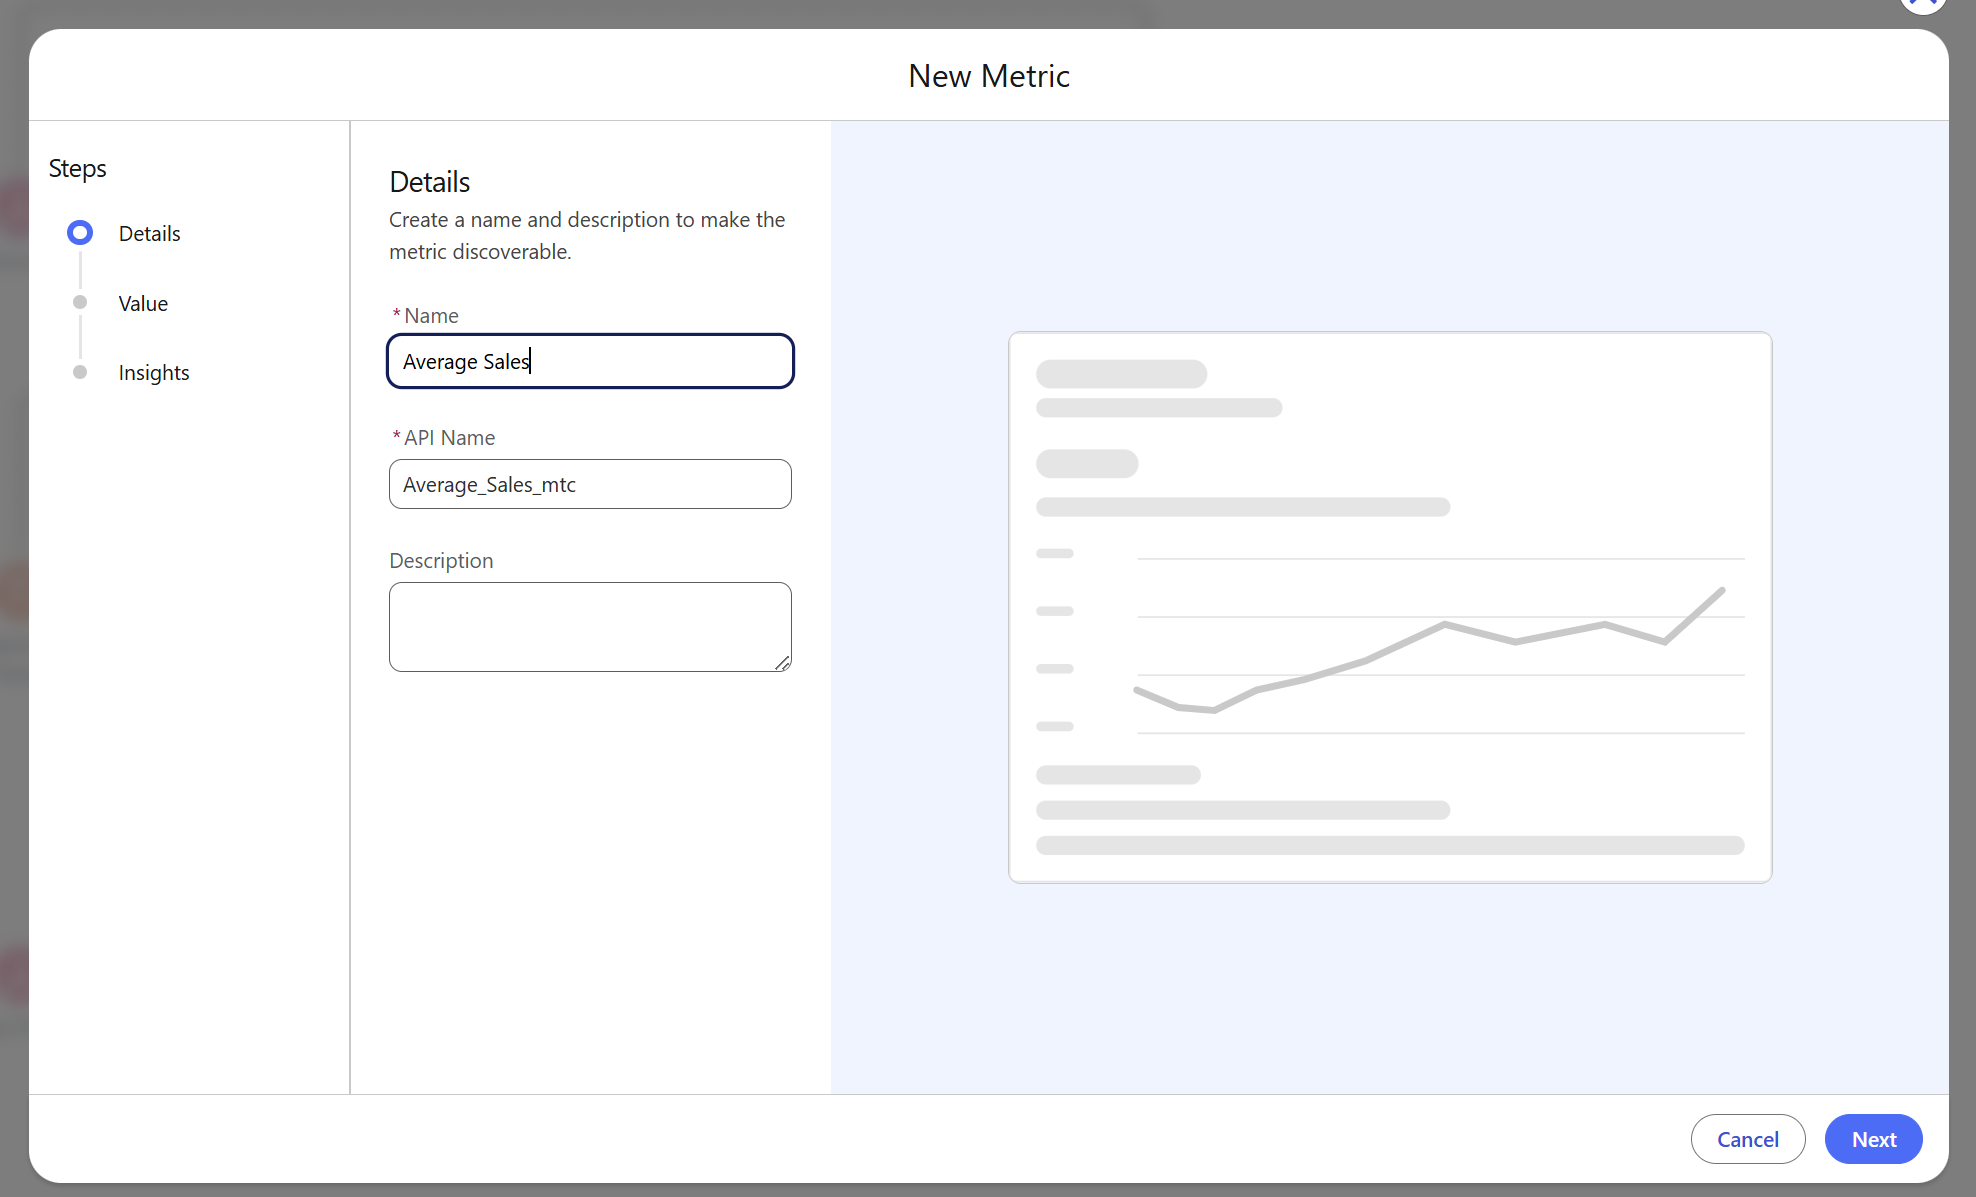
Details
The details pane is where you specify a name and a description to make your metric discoverable.
As you fill out the name for your metric - Tableau Next will automatically fill out the API name.
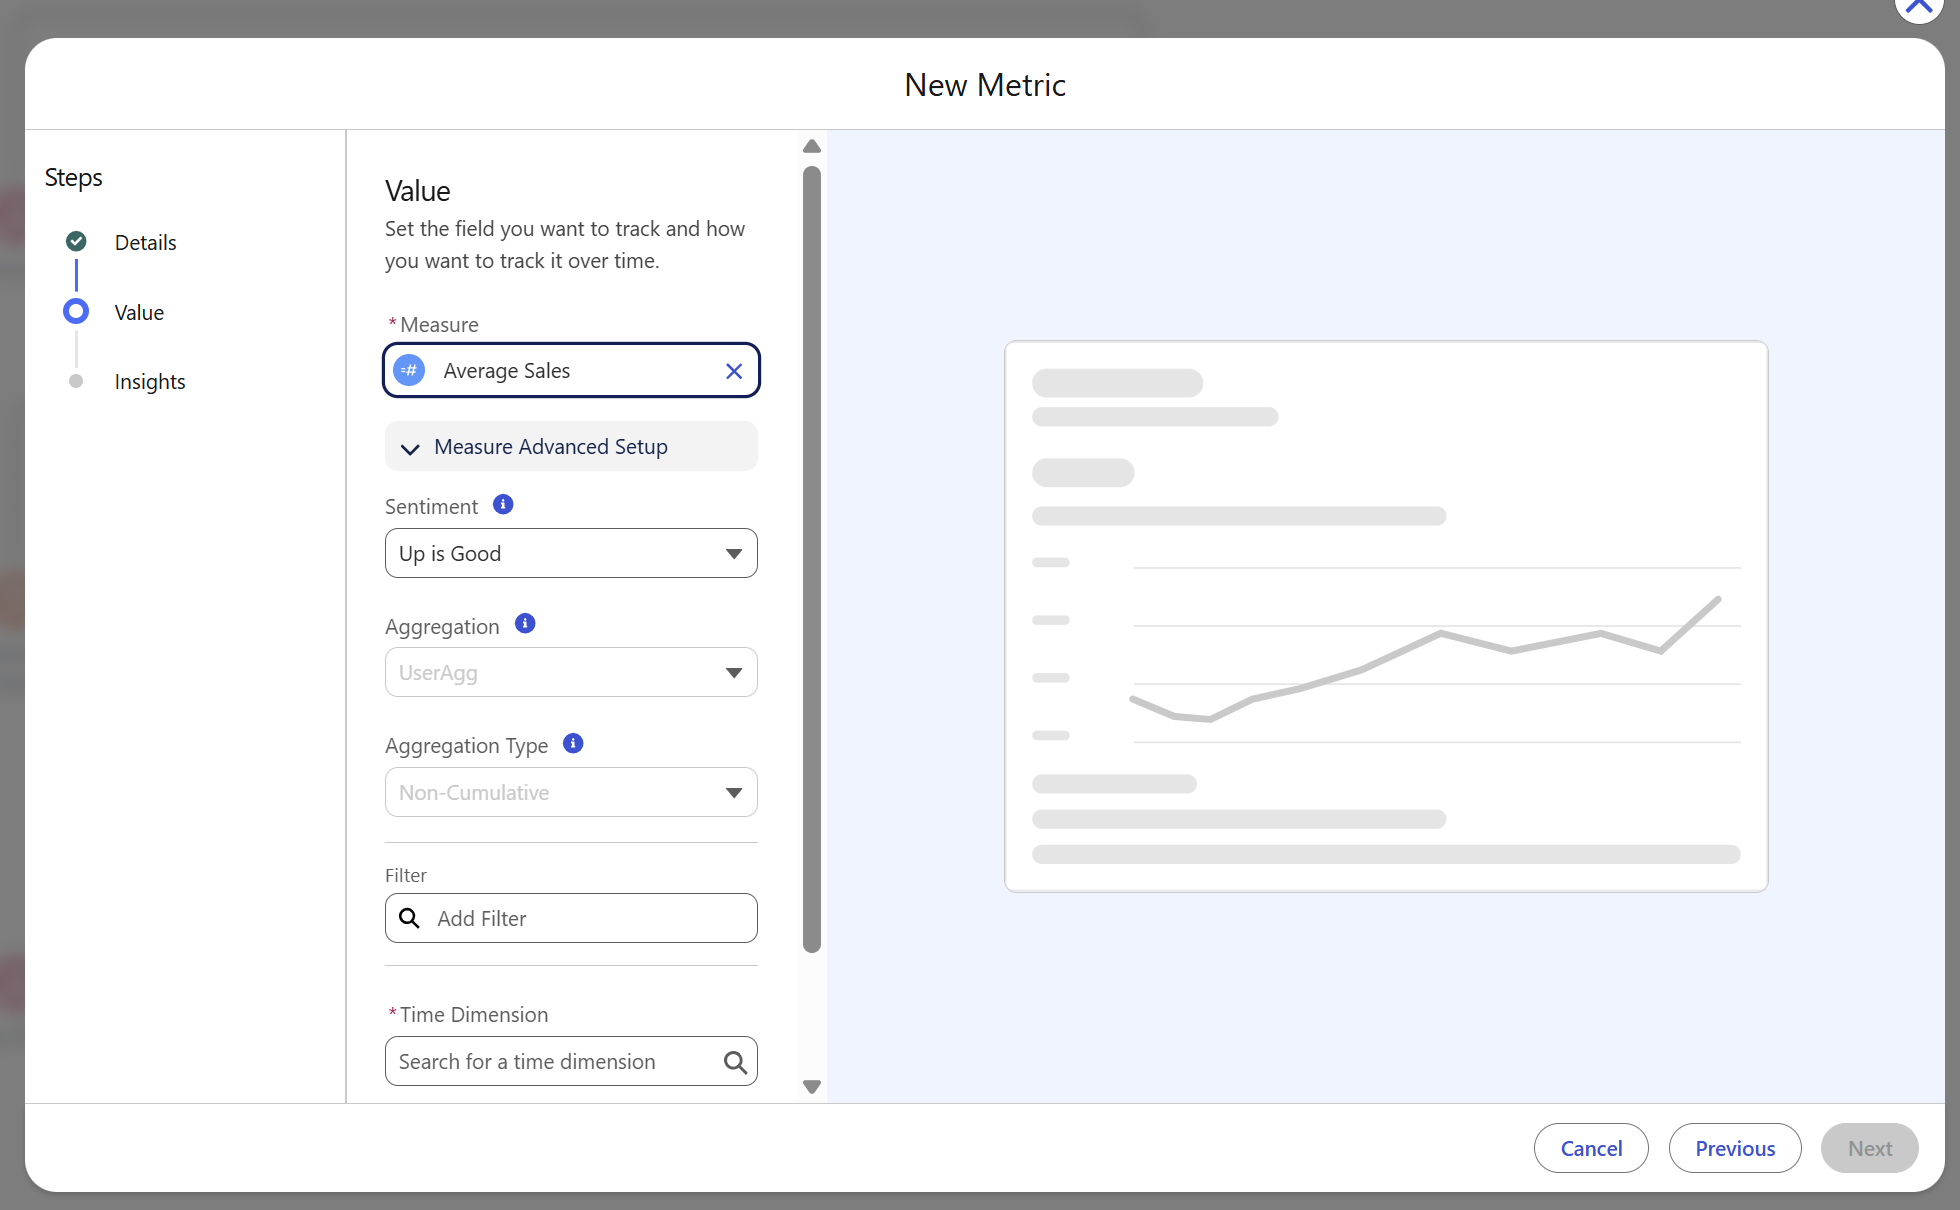
Value
The values pane is where you specify the field you want to track and how you want to track it over time.
When you click on the "Measure" text box you will see a list of all your created calculated measures at the top, with the option to create a new one within this view. This is then followed by all the measures that exist in your tables within your semantic model.
The measure you select is the field that you want to track within your metric.
Below this there is an "Measure Advanced Setup" dropdown, here you will find the following:
- Sentiment - specify whether an upward trend is good, bad or neutral.
- Aggregation - specify the aggregation method to be applied to your measure.
- Aggregation Type - specify between non-cumulative and cumulative in how your data is summarised over time.
There is also an option to add a filter in this pane. Here you can filter by a selected field within your semantic model.
You must also add a time dimension within your metric. Similar to the "Measure" box, the "Time Dimension" box will contain any calculated date dimensions you have made followed by the date dimensions that exist within your tables.
The last section of the values pane is the option to add "Additional Dimensions". Here you can add dimensions to refine the metric, enabling insights and custom filters. If you do not specify any additional dimensions, you will not be able to see any auto-generated insights for your metric.
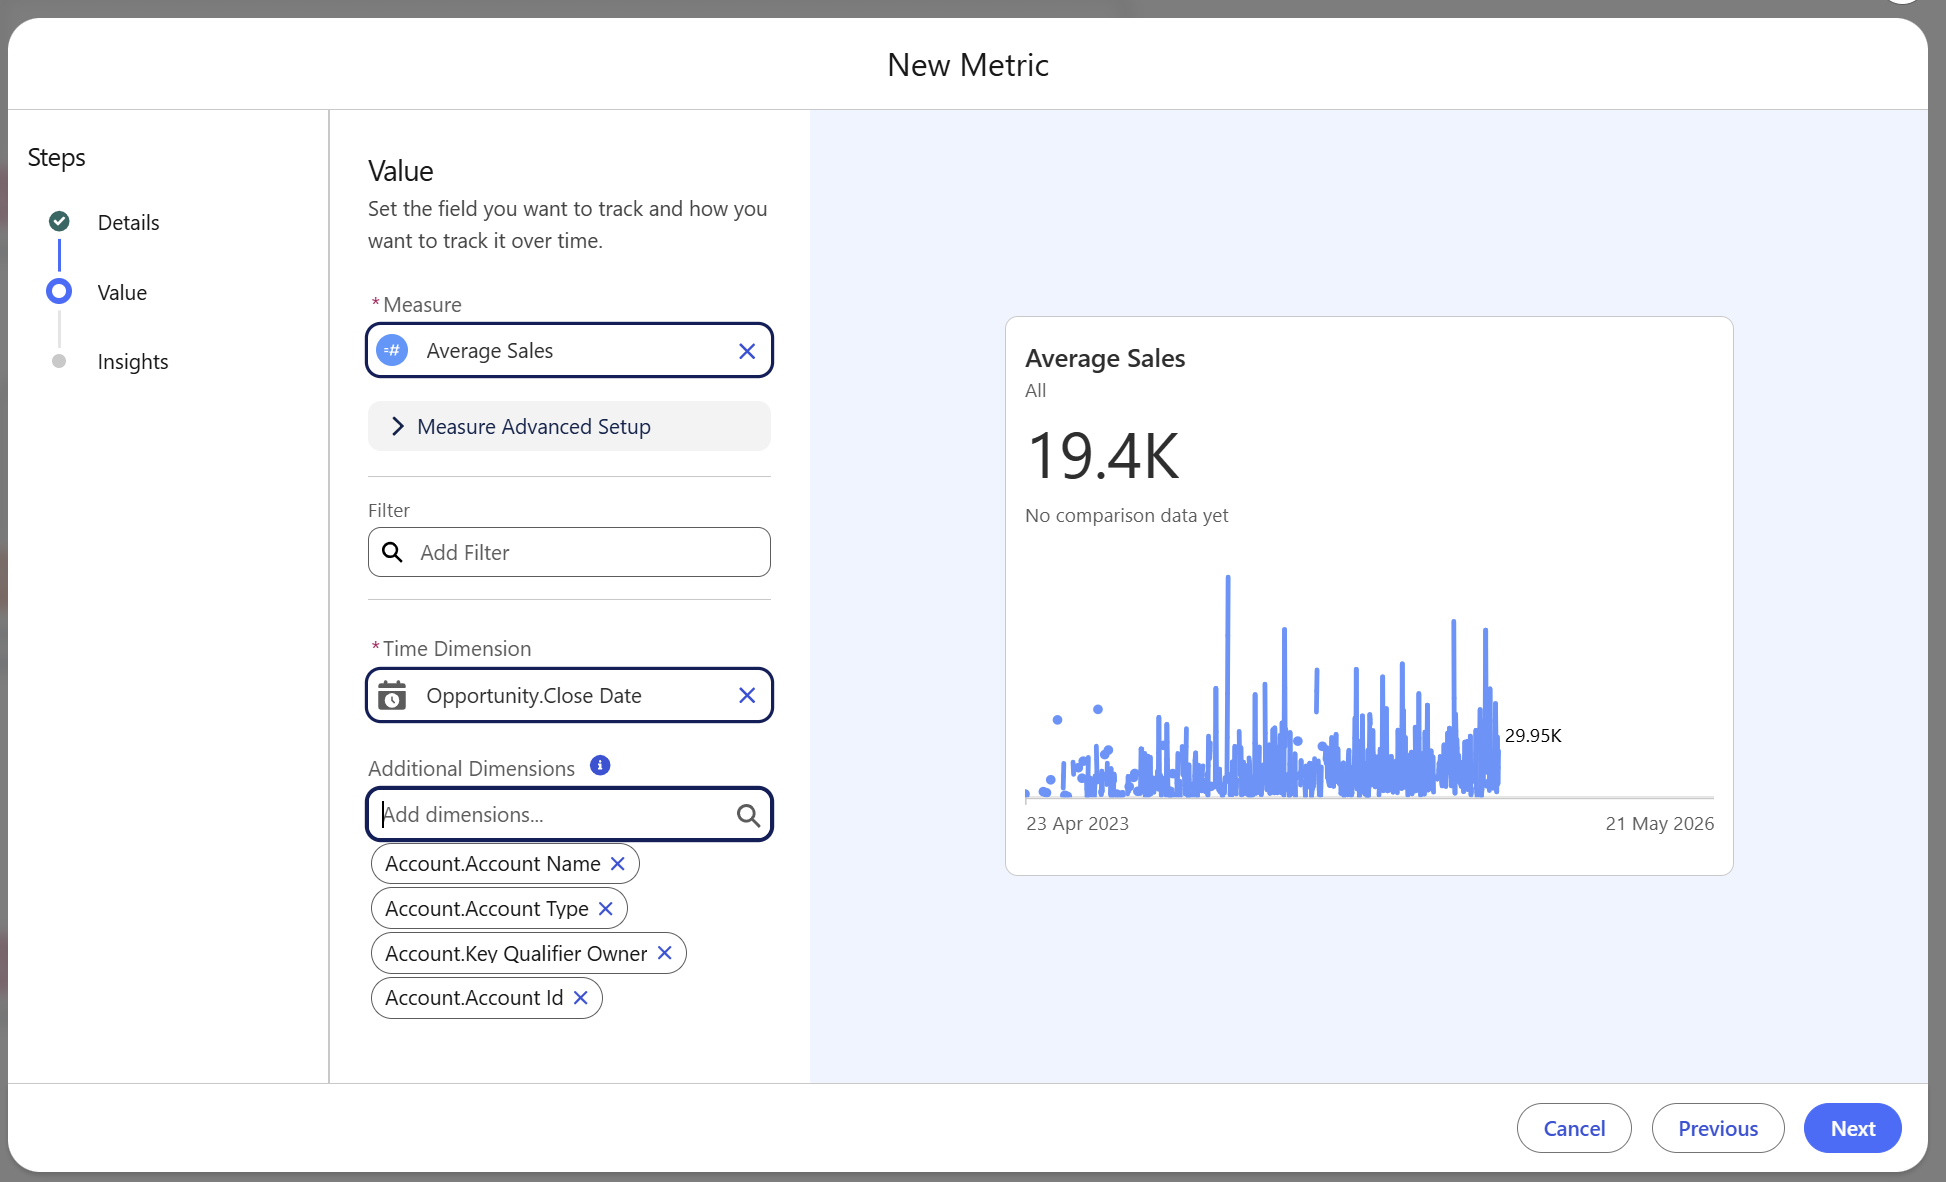
As you fill out the values pane, a preview of your metric will start to build on the right.
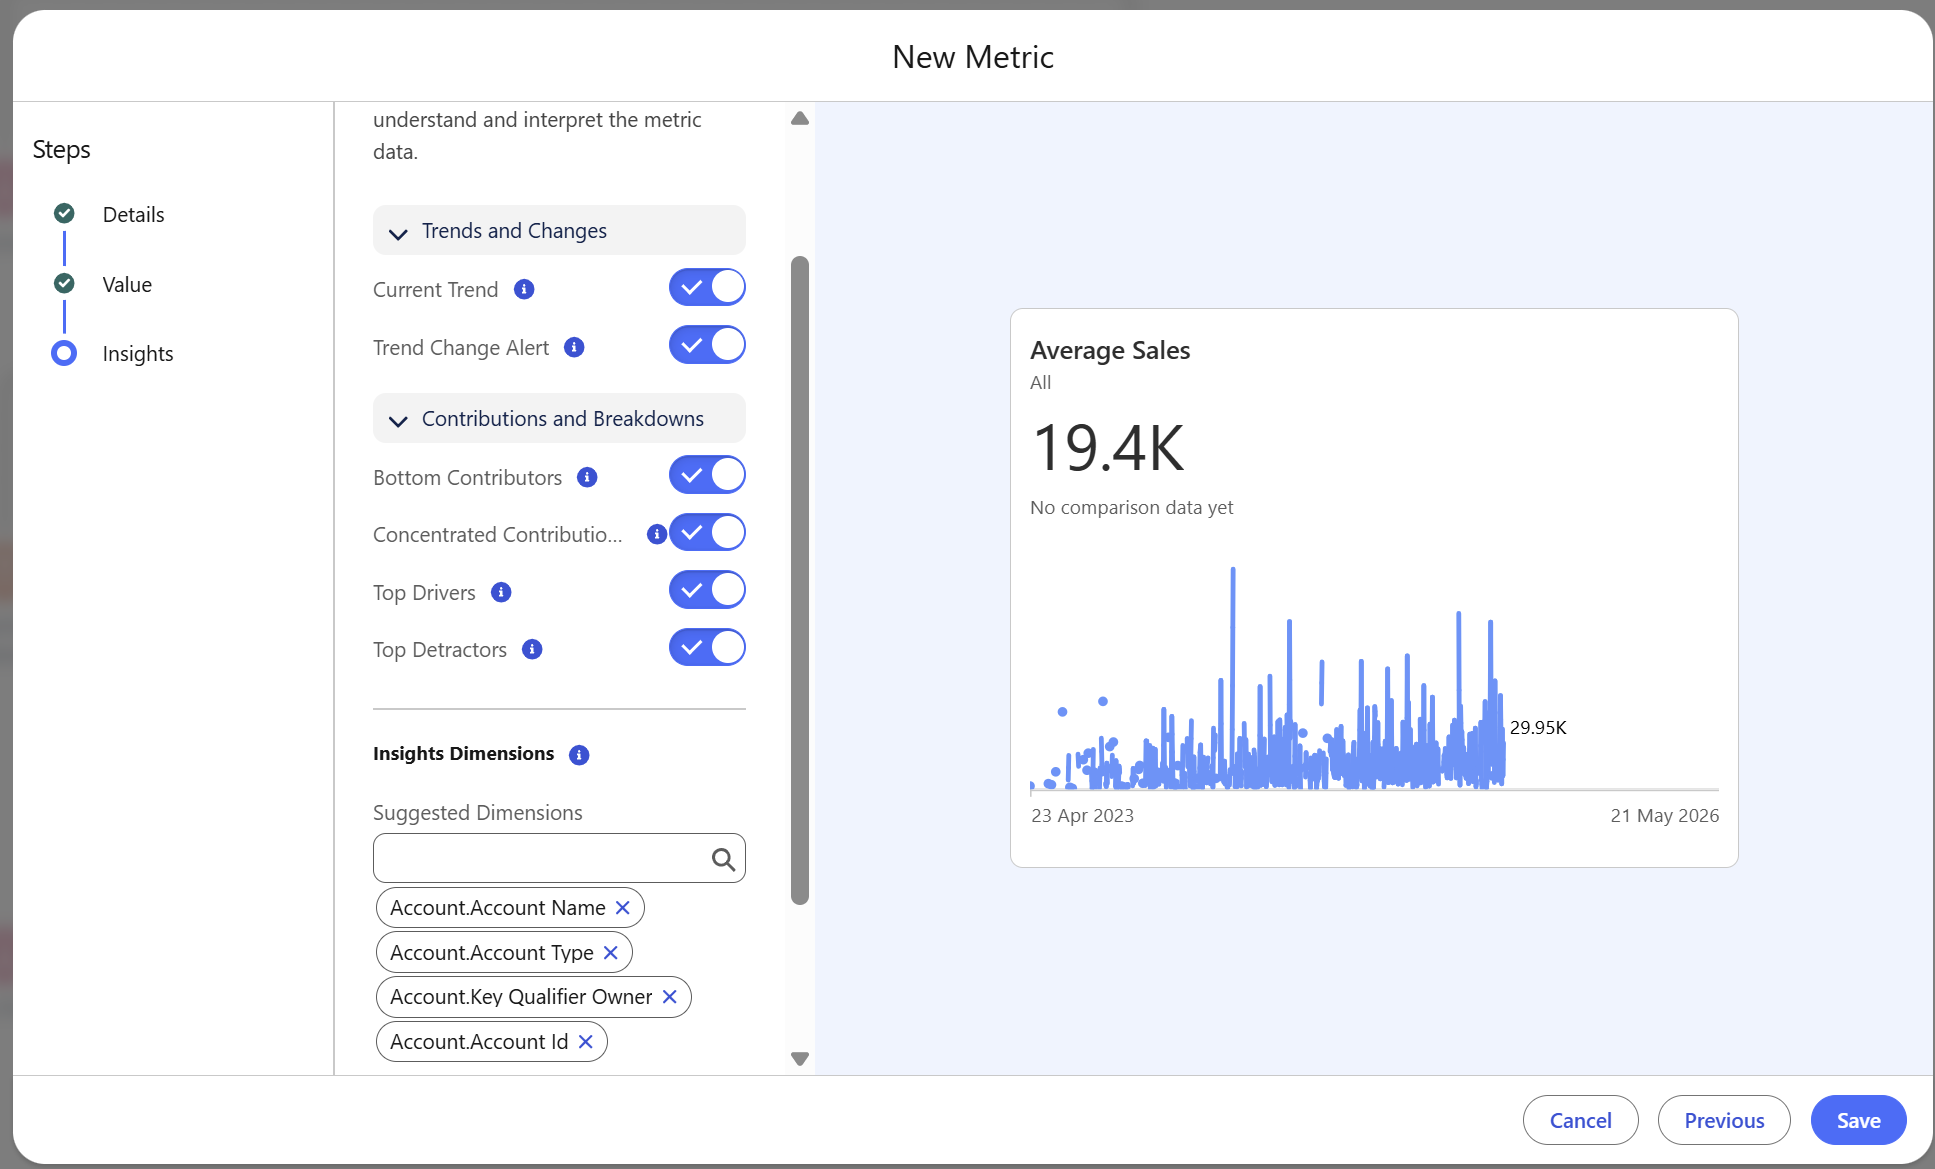
Insights
Your insights will be generated based on your metric setup and your previously defined additional dimensions.
You can specify:
Trends & changes
- show the current trend, highlighting the rate of change, direction and fluctuations in the metric value.
- identify new trends that significantly differ from the current trend.
Contributions & breakdowns
- show the bottom contributor (lowest value) in a metric dimension.
- highlight the dimensions with a concentration of very high values.
- show the top drivers (metric values that have increased the most over a specific period of time).
- show the top detractors (metric values that have decreased the most over a specific period of time).
The second part of the insights pane is specifying which dimensions you want Tableau Next to evaluate as part of the auto-generated insights. Only dimensions that you have previously defined in your "Additional Dimensions" will show up here.
Watch the video below for a full walkthrough on creating a metric.