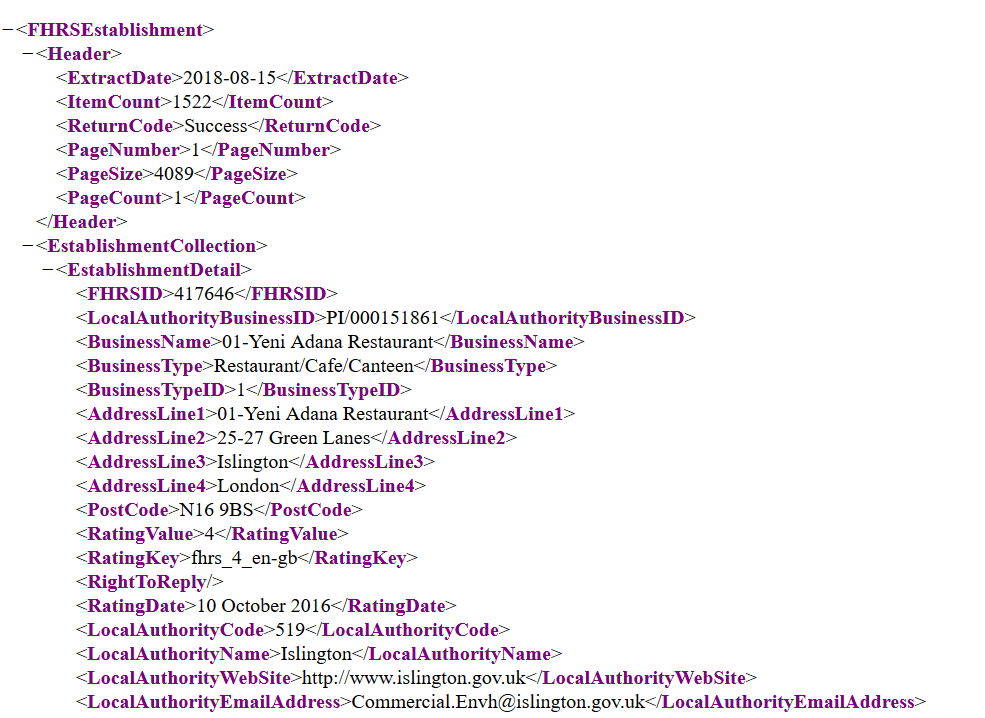
On day 3 of dashboard Week we investigated food hygiene ratings across the UK. In order to obtain the data we had load XML files into Alteryx which looked like this:
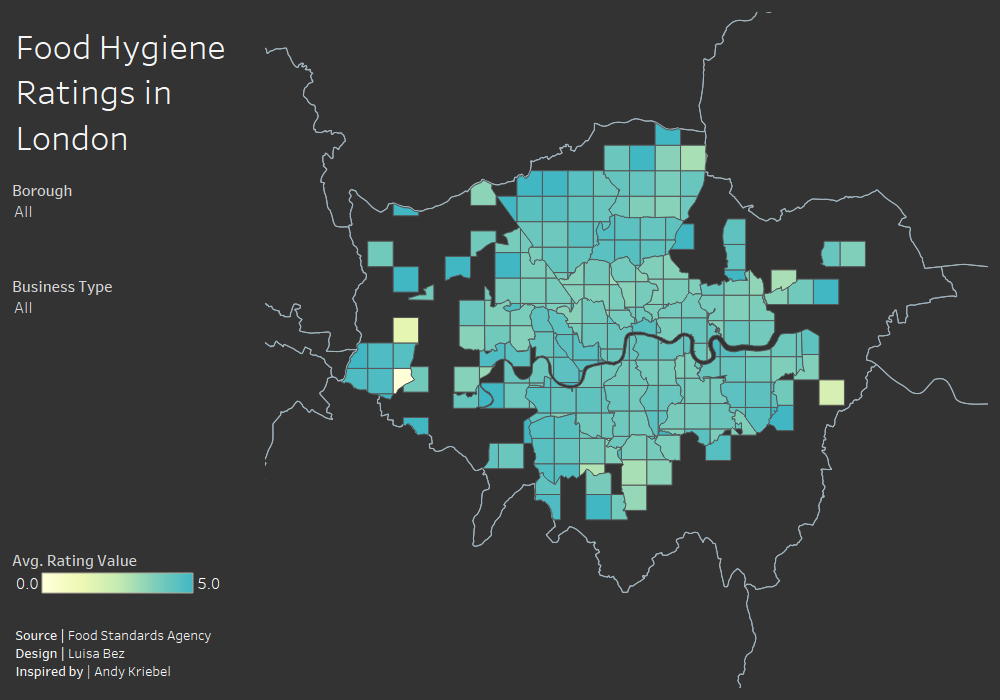
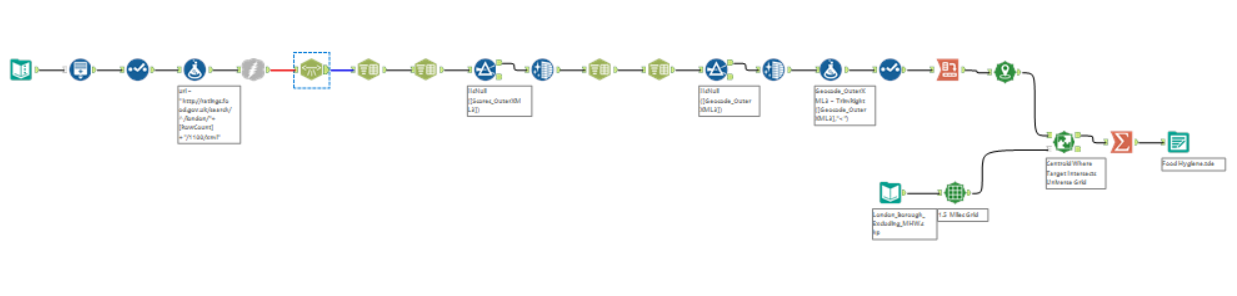
We used an XML Parse tool and included Child Values and Outer XML which returned surprisingly clean data. Food Scores as well as longitude and latitude needed some additional parsing and cleaning, but the workflow itself was quite simple. I wanted to create a grid map like this one by Andy so I converted long/lat to spatial points and joined them on the London boroughs.
Lastly, we had to generate rows to download all records as they were stored on different pages. It’s actually the first step in the workflow, but we added it last so we wouldn’t get blocked from downloading a large amount of data from the website.
I created a simple view of average ratings by grid. You can select the borough and business type you’re interested in to drill down on the data.