Day 4 of dashboard week covered yet another sports dataset: 147 years worth of baseball data. Data preparation was fairly simple as we just needed to obtain headers for every column containing our data. Our Alteryx workflow looked like this:
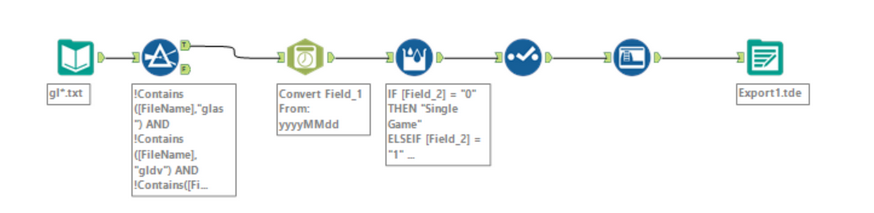
We started with a wildcard input to read in all files from 1871 – 2017. The Date Time tool converts the data columns from a string format to a date format. Lastly, the multi-row formula toolseparates the data into different columns categories.
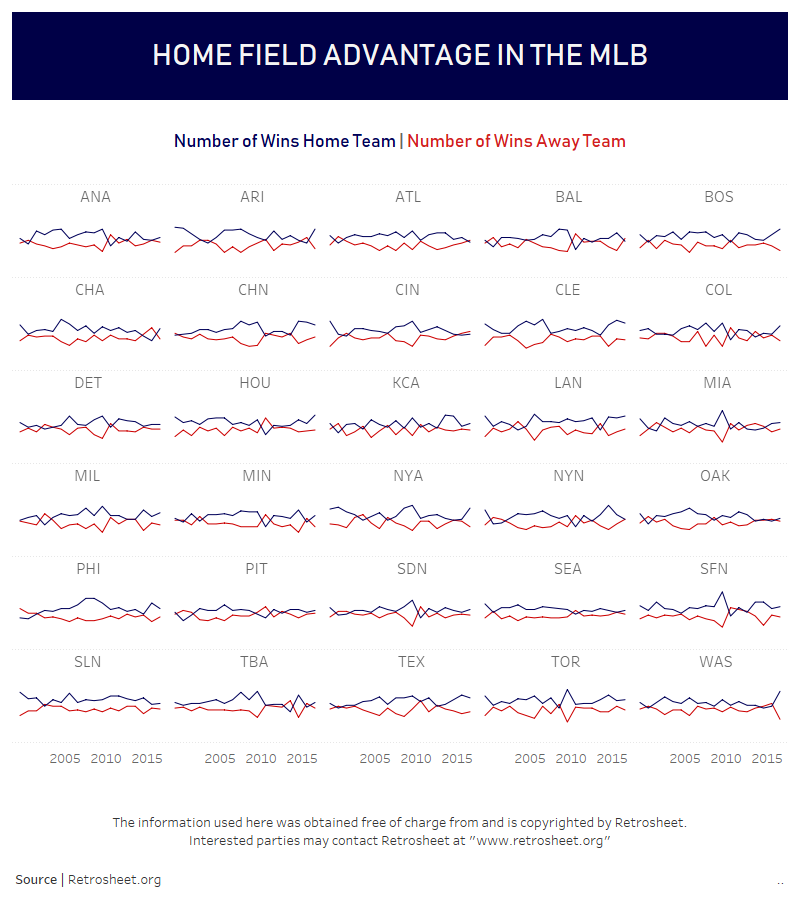
Today was the hardest day in terms of coming up with an idea for a viz as I know literally nothing about baseball. I knew I wouldn’t cover any of the specific terms like put outs, triple plays etc and decided to find out if there was a home field advantage for each team over the years. One of the issues with the data was that it split teams into home and visiting teams and we couldn’t tell immediately which team won. In order to identify games won we came up with the following calculation:
Number of wins home team:
COUNT(if ({ FIXED DATETRUNC(‘day’, [Date]) : SUM([Home Score])-SUM([Visiting Score])}) > 0 then 1 end)
Number of wins visiting team:
COUNT(if ({ FIXED DATETRUNC(‘day’, [Date]) : SUM([Visiting Score])-SUM([Home Score])}) > 0 then 1 end)
Using these fields I generated a trellis chart which you can find here.