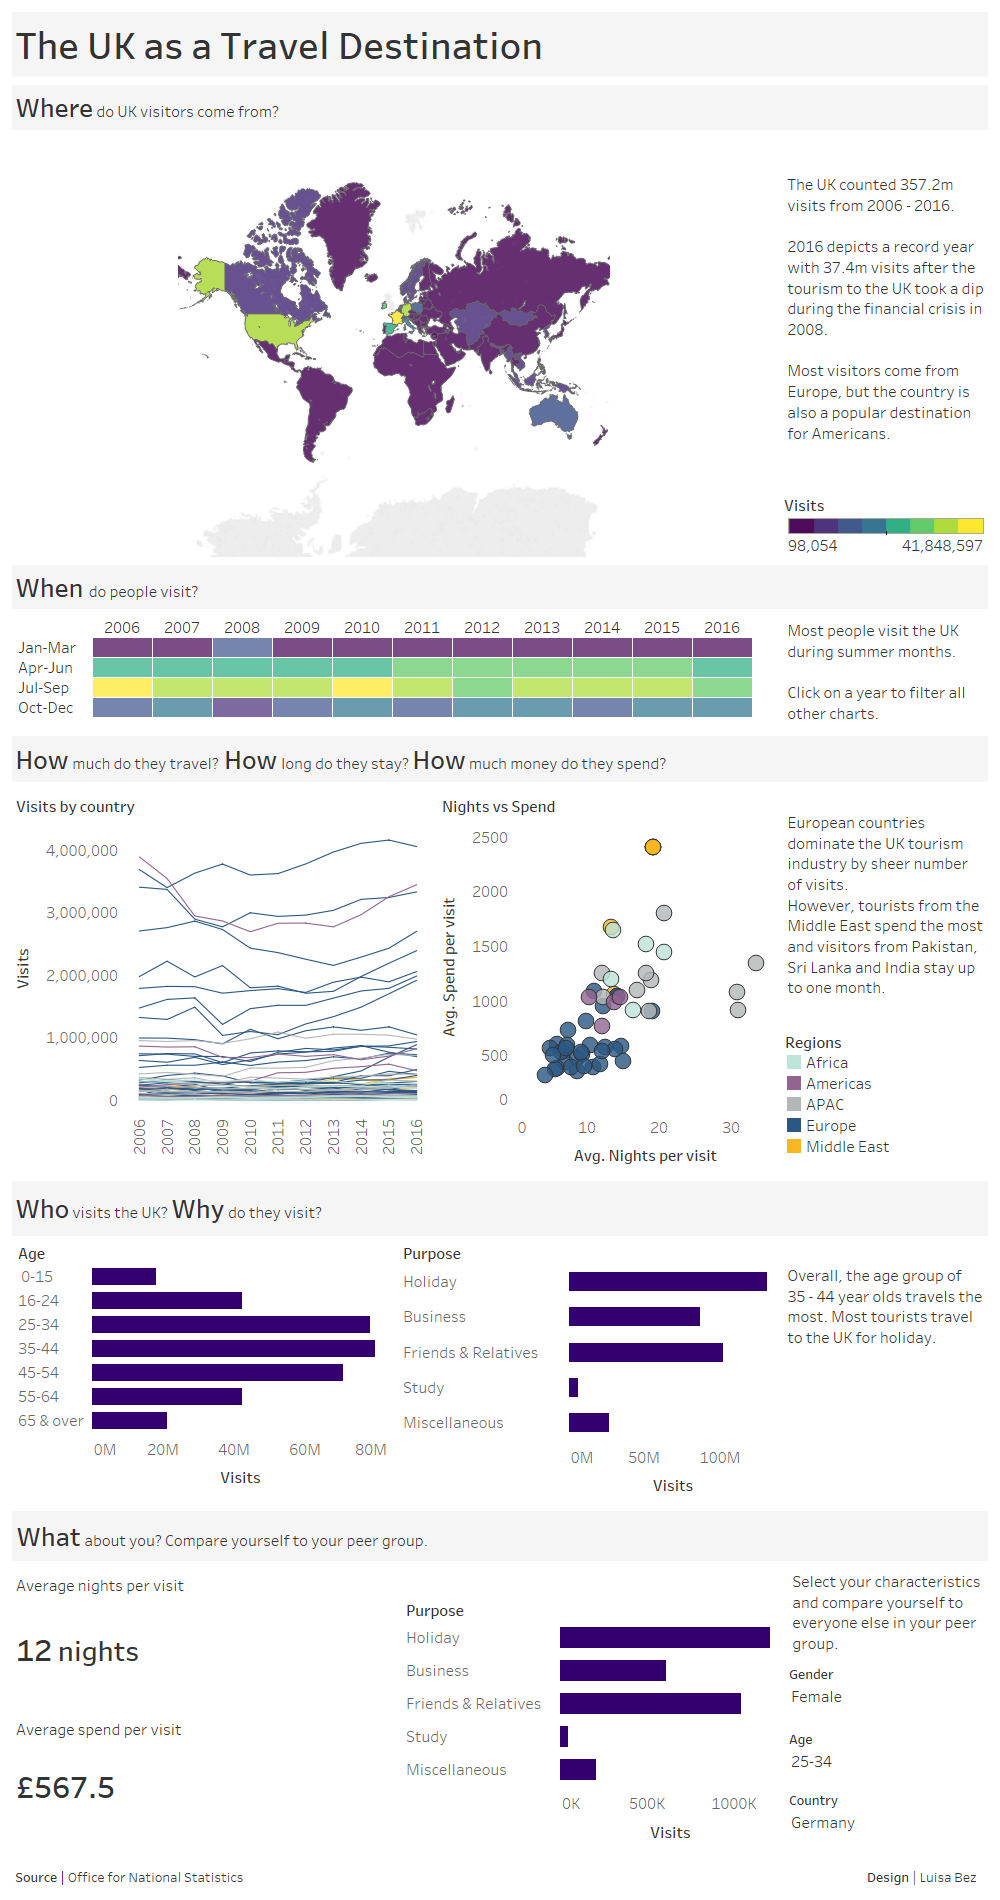
Friday is Project Day at DS and in our first week we were lucky enough to be able to work with a familiar dataset: our application. The task was to supplement the first (or second) viz with additional data. I decided to remake my first viz on UK Tourism as it didn’t contain a map. I wanted to add one initially, but couldn’t find a way to add all necessary datapoints without manually going through 400,000 rows in Excel. It turned out the whole process is fairly simple with Alteryx once you get the hang of it.
The original dataset contained granular country data as well as regions such as ‘Other Africa’. Obviously, Tableau doesn’t know where to plot these regions and the original map looked like this with SUM(Visits) on colour:
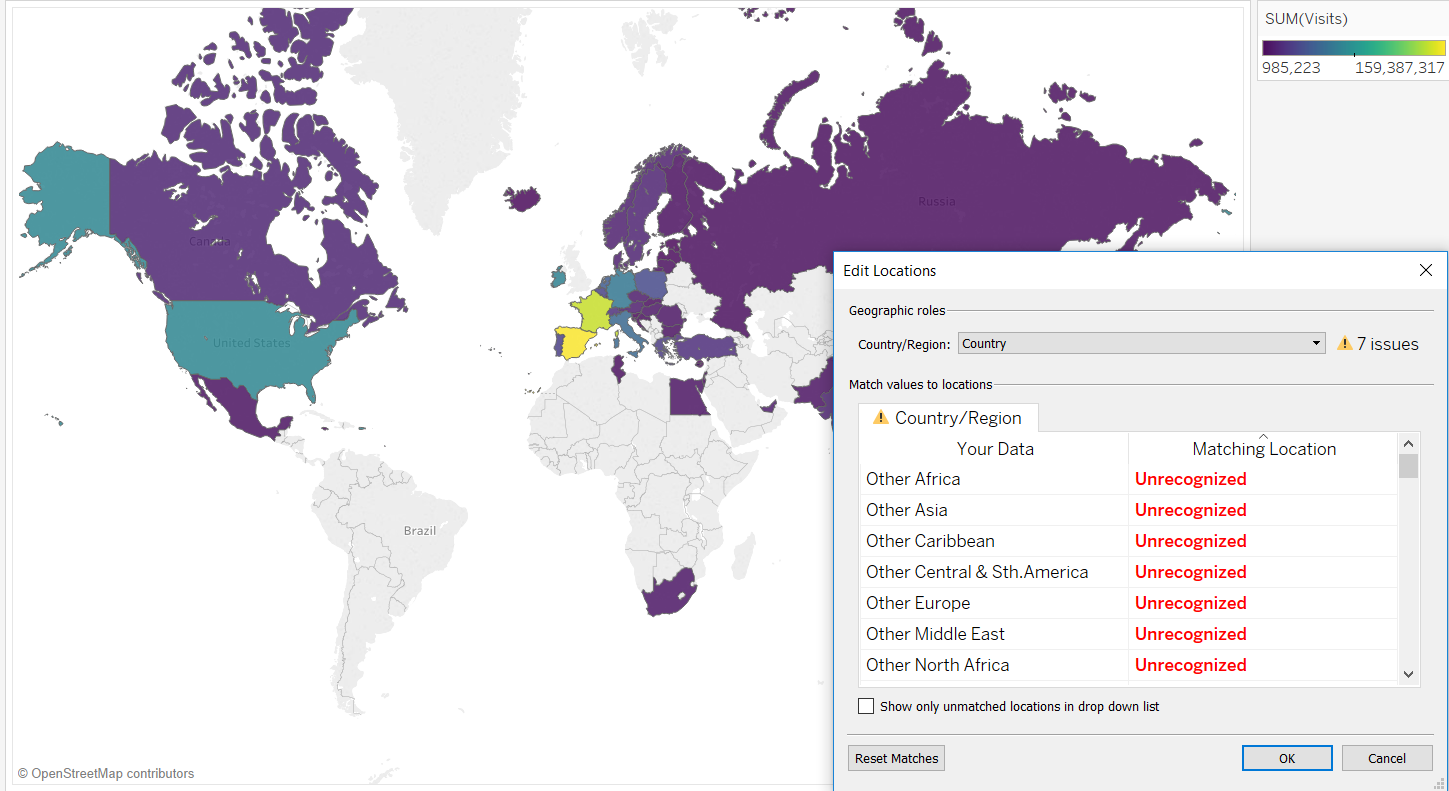
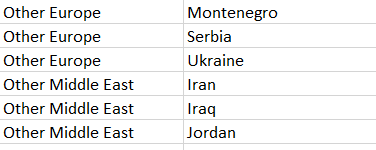
As you can see, seven regions are missing. In order to create a custom region in Tableau all underlying countries need to be specified and connected to those regions. I created an Excel file with all missing countries to join on the original file:
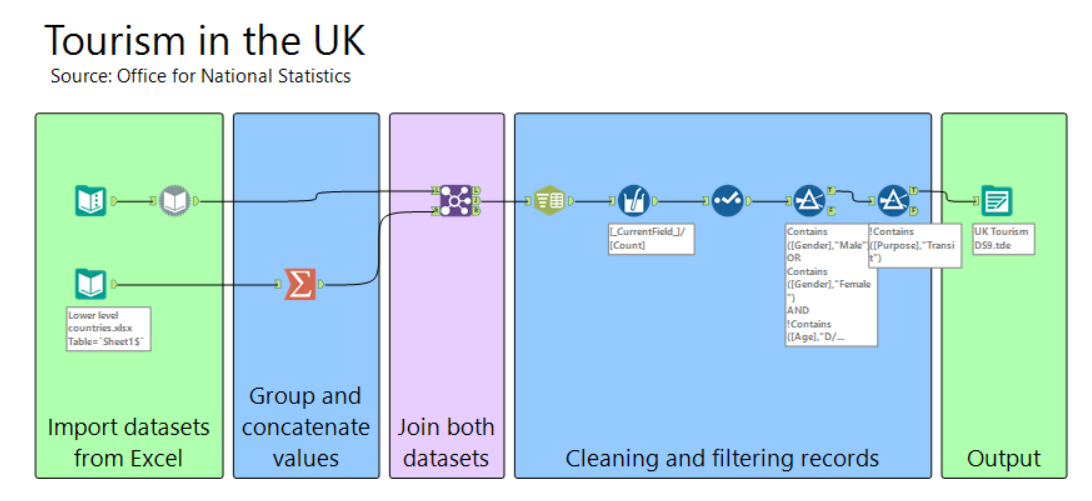
But let’s say the SUM(Visits) for ‘Other Europe’ amounted to 20 and I replaced the region with 20 underlying countries. If I aggregated this in Tableau I’d get 20 (countries) * 20 (visits) = 400 which isn’t correct. Instead, I let Alteryx count the number of countries per region and concatenated all these countries so I wouldn’t lose that level of detail. After joining both files I split the concatenated fields into rows and divided their visit values by number of countries. The remaining steps included data cleansing and filtering. You can take a look at the workflow below:
The final map looks much more complete! You can take a look at my new viz here and compare your travelling habits with your peer group (if you’re not a UK resident).