


In this blog, I’ll be working through the Preppin’ Data challenge called Student Attendance vs Test Scores. You can find it here. This was a pleasantly straightforward challenge where, among other functions, I got to use the ROUND function. Give the challenge a try!
This blog will consist of screenshots of my queries, outputs and descriptions of what the queries are doing.
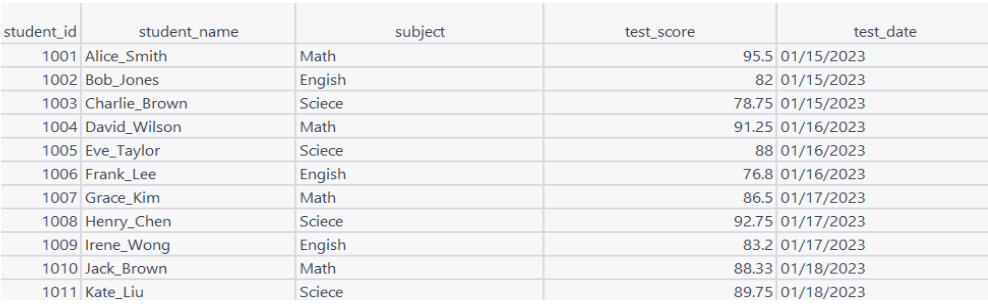
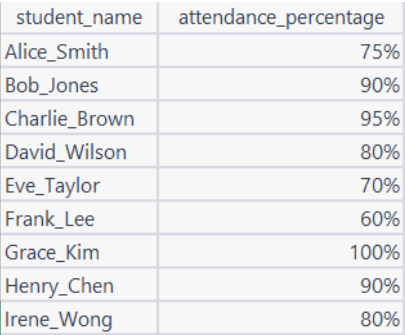
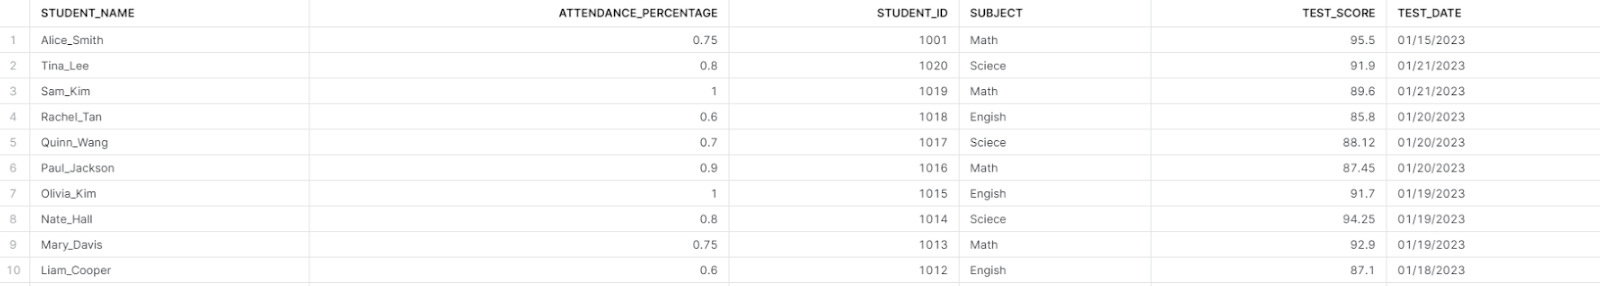
There are two main parts to this challenge. First, the tables Student Test Scores and Attendance Figures (pictured below) have to be joined together. Second, some data cleaning and prepping is needed in order to finalize the resulting table.
The image below shows the Student Test Scores table.
The image below shows the Attendance Figures table.
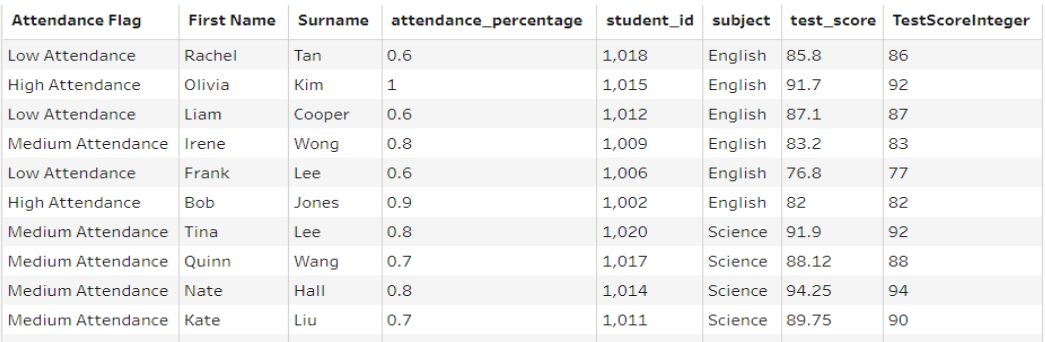
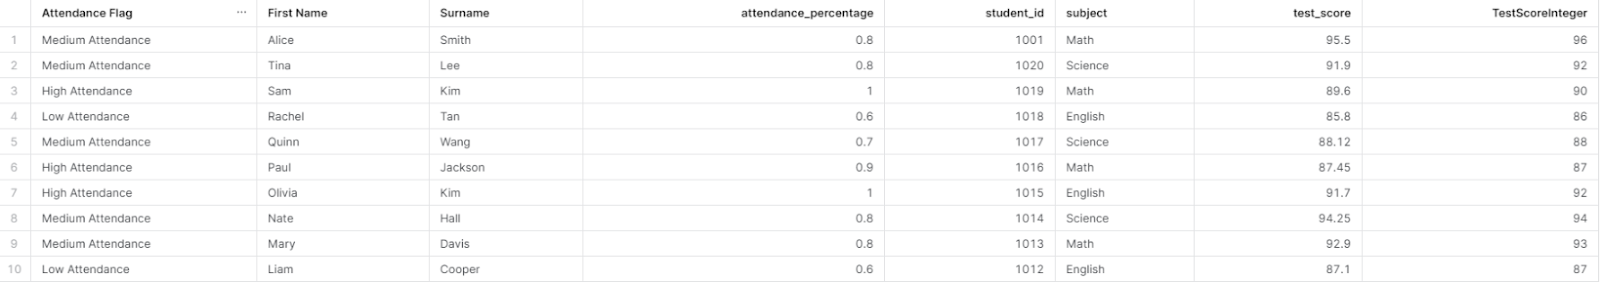
Here's the desired final output. This is what all of our SQL queries will result in!
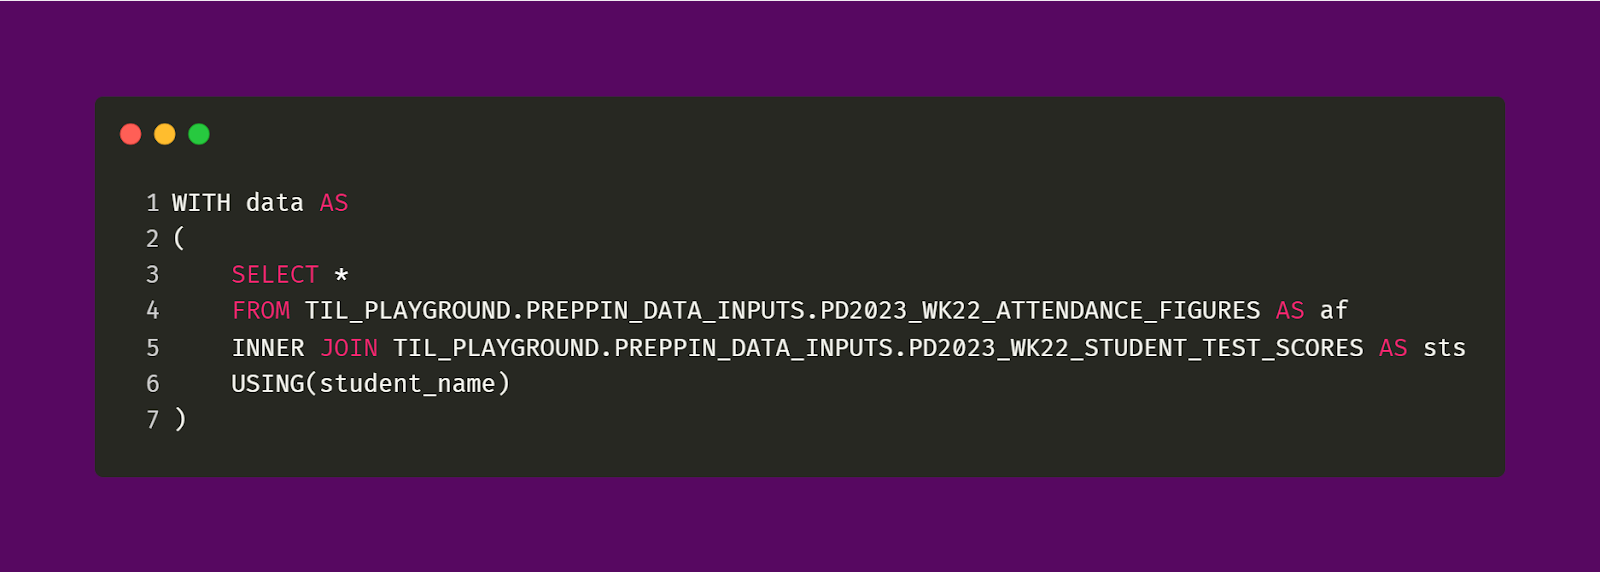
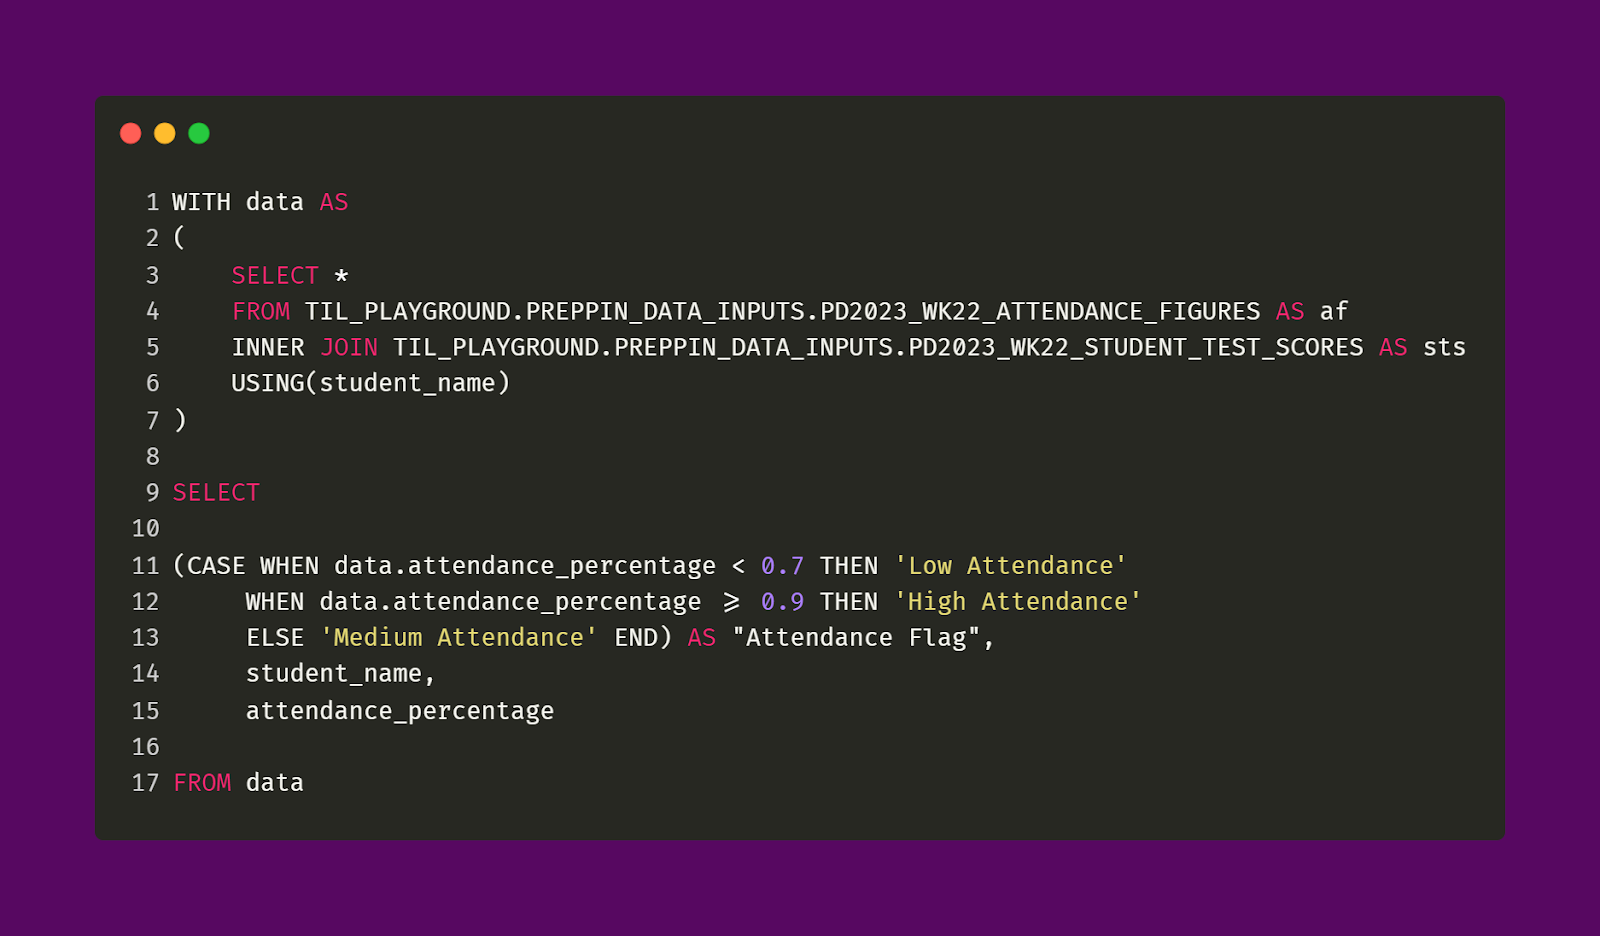
The image below shows the SQL query responsible for joining the Student Test Scores and Attendance Figures tables. As you can see, I didn’t use the normal ON [. . .] syntax. This is because, in the case of this challenge, both tables have an identical field (student_name). Alternatively, I could have also used the WHERE function in order to join.
As you can see, it’s not enough to just join the two tables. There are a couple of problems with the result which needs to be addressed, such as having to make a First Name and Surname field, rounding the Attendance Percentage field, correcting the spelling mistakes in the Subject field and some other changes.
Let’s tackle the constructed field of the Attendance Flag first. As the challenge tells us, we have to compare each student’s attendance percentage value with a defined threshold. In this case, Low Attendance is defined as any attendance percentage that is less than 0.7. Conversely, High Attendance is defined as any attendance percentage that is greater than or equal to 0.9. To be clear, as shown in the challenge’s desired output, students whose attendance percentages are exactly 0.7 are categorized as having Medium Attendance.
The query snippet below shows the logic of the Attendance Flag field.
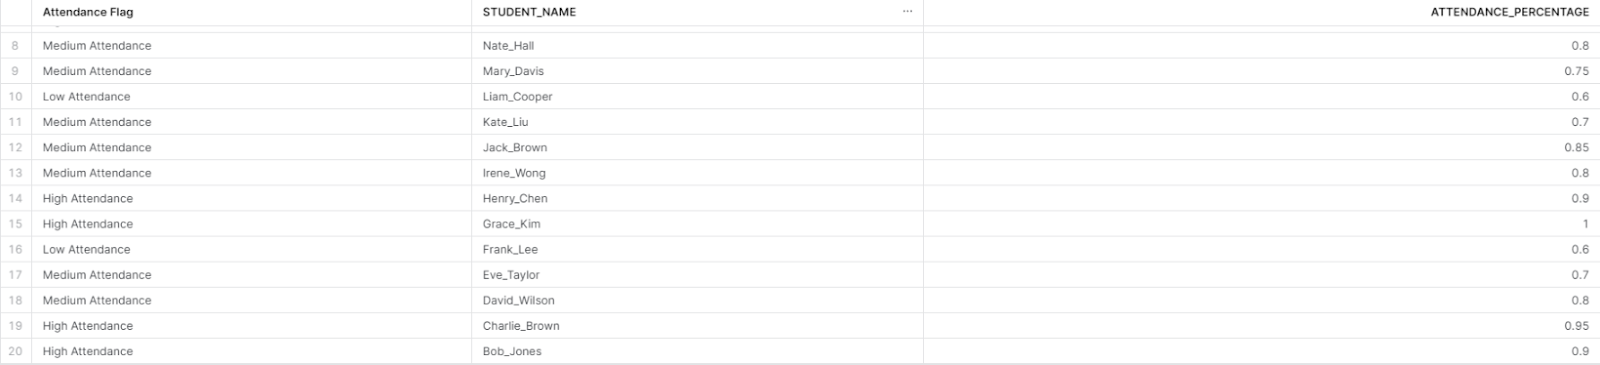
Take a look at Bob Jones at the last row of the image above. His attendance rate is 0.9 This matters because the logic of the High Attendance value in the Attendance Flag field is inclusive. In other words, the logic assigns High Attendance for any student whose attendance percentage is 0.9 or higher.
This is important because if the logic was strictly just looking for attendance percentages that were just higher than 0.9, that would mean Bob Jones would be assigned a Medium Attendance, which would differ from the desired output. In contrast, having an attendance rate of 0.7 would not lead to a student being categorized as having Low Attendance but instead Medium Attendance (look at row 11 for Kate Liu). This is because the logic for the Low Attendance is non-inclusive. That is, only those attendance percentages that are below 0.7 are categorized as Low Attendance.
In other words, it’s crucial to be careful with how thresholds are defined if we want to convey our data accurately and meaningfully. We can get totally different results if we get confused about how we use comparison operators!
Moving on, let’s look at how the Student Name column was handled to be able to create two new fields that represent First Name and Surname respectively. This can be seen in the SQL query below.
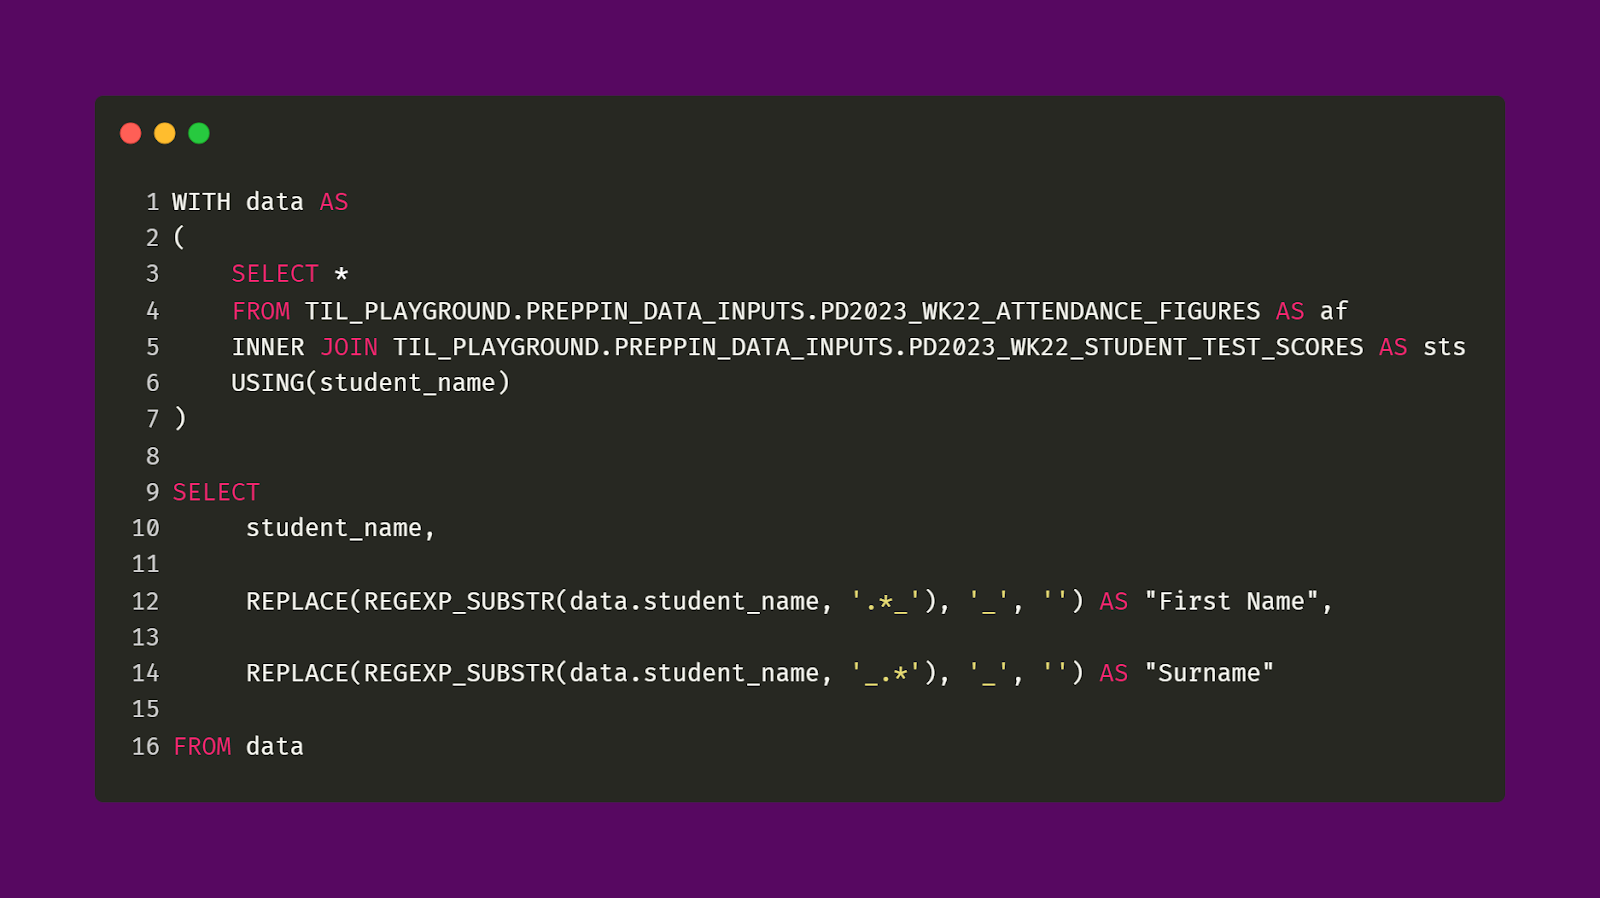
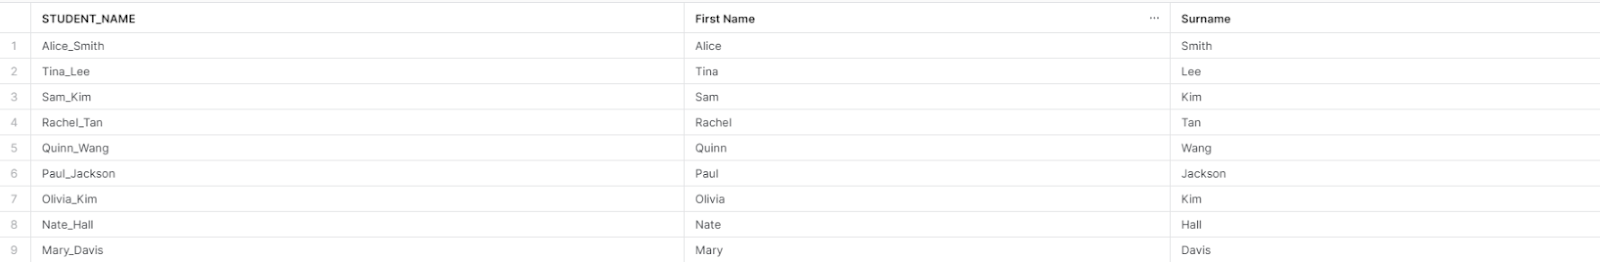
In the query above, I use the REPLACE function and the REGEXP_SUBSTR function to precisely capture and modify a specific pattern from the Student Name field. For the First Name field, I am taking every character before the underscore symbol. Oppositely, in the Surname field, I am taking every character after the underscore symbol. Either way, we can “take every character” by using .* which represents every character in a string. The period symbol represents any single character and the asterisk symbol represents one or more of the preceding character. So, when combined, .* would capture every character within a string. In my case, this works perfectly for me.
However, if the Student Name field was messier and had unneeded characters, such as "M3a!!rk_S3m1TH", then I would need to change my regex pattern to filter out said characters in order to just get "Mark Smith". In other words, RegEx is best when handling really sensitive/particular strings. Finally, I need to use the REPLACE function so that I can remove the underscore.
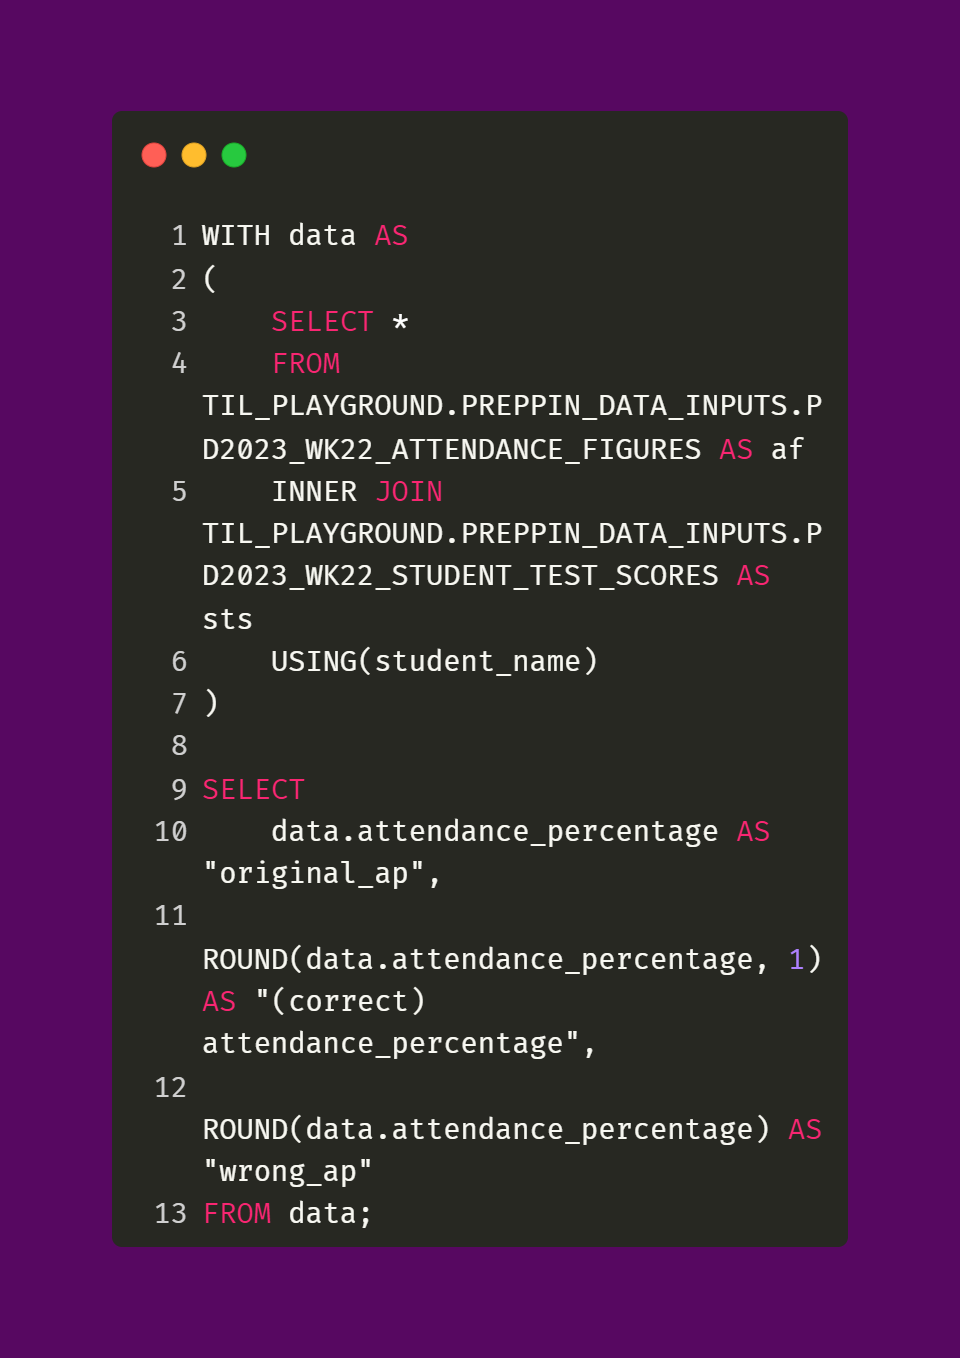
The next two fields, Attendance Percentage and TestScoreInteger, involved using the ROUND function. However, as you can see in the desired output, these two fields are two different types of numbers. Attendance Percentage is a decimal while TestScoreInteger is an integer. When using the ROUND function, it matters what the original number format is for the affected field. To see why, take a look at the supplemental query and output below. It showcases why configuring the ROUND function in an appropriate way matters.
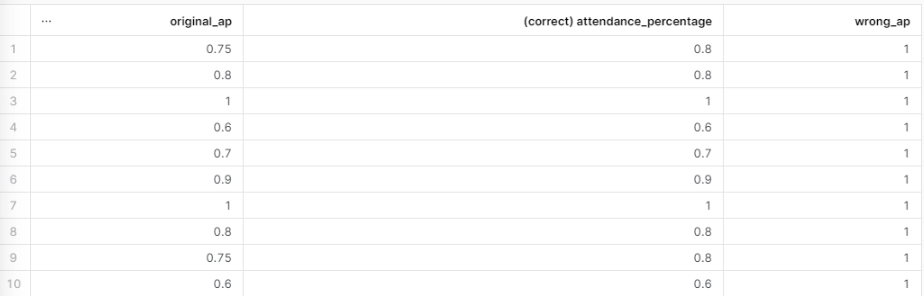
As you can see, if we were to just ROUND the Attendance Percentage field normally, every student’s attendance percentage would be 1. If we used the wrong_ap field in the query that is responsible for the Attendance Flag field, then the logic would totally break and every student would be categorized as having High Attendance. Not only would this differ from the desired output, this would completely undermine any attempt to determine if there’s “a correlation between attendance and test scores” (as the challenge post outlines as the reason for this work.)
However, in the case of the TestScoreInteger field, we can just round the test_score field normally. Ultimately, we just have to be careful about what data changes we’re doing to our data. Are those changes actually necessary or correct? If not, then that could cause a lot of confusion for end users who are then going to use the datasets that we prepare, such as populating a C-suite facing dashboard with misleading numbers. Imagine showing a totally wrong KPI to the CEO because of a rounding error or because of some faulty aggregation logic. What a disaster!
The last field that needs to be fixed is Subject. The problem with this field is that the subjects of English and Science are misspelled. This is shown with the supplemental query and output below.
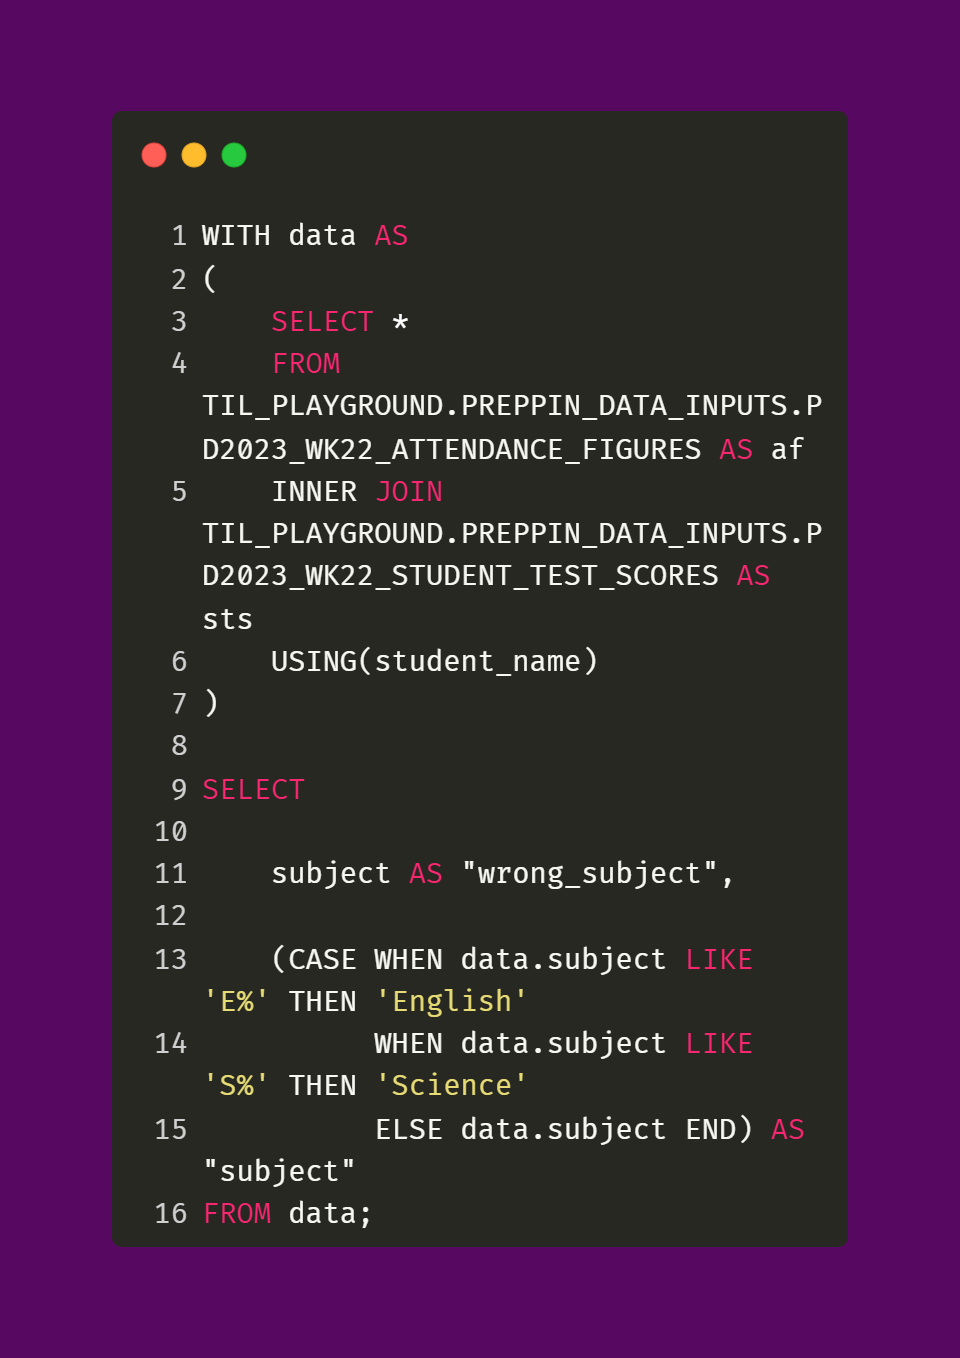
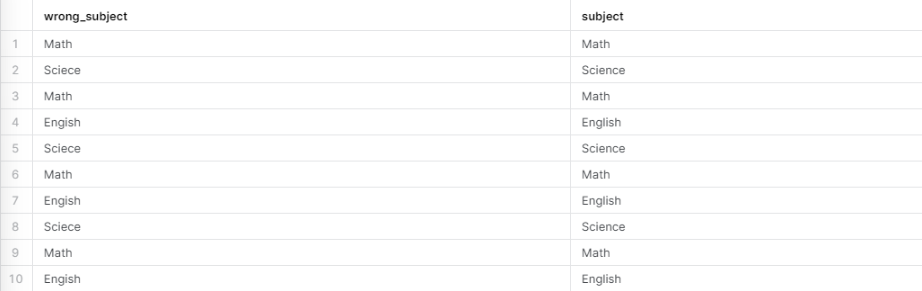
To fix the misspelling of “Sciece” and “Engish”, I used two CASE statements and the wildcard character % which looks for every character in a string. In this case, I want to look for every string in the original Subject field that starts with “S” and “E” respectively. Once those strings have been found, I replace them with the correct spellings of “Science” and “English”.
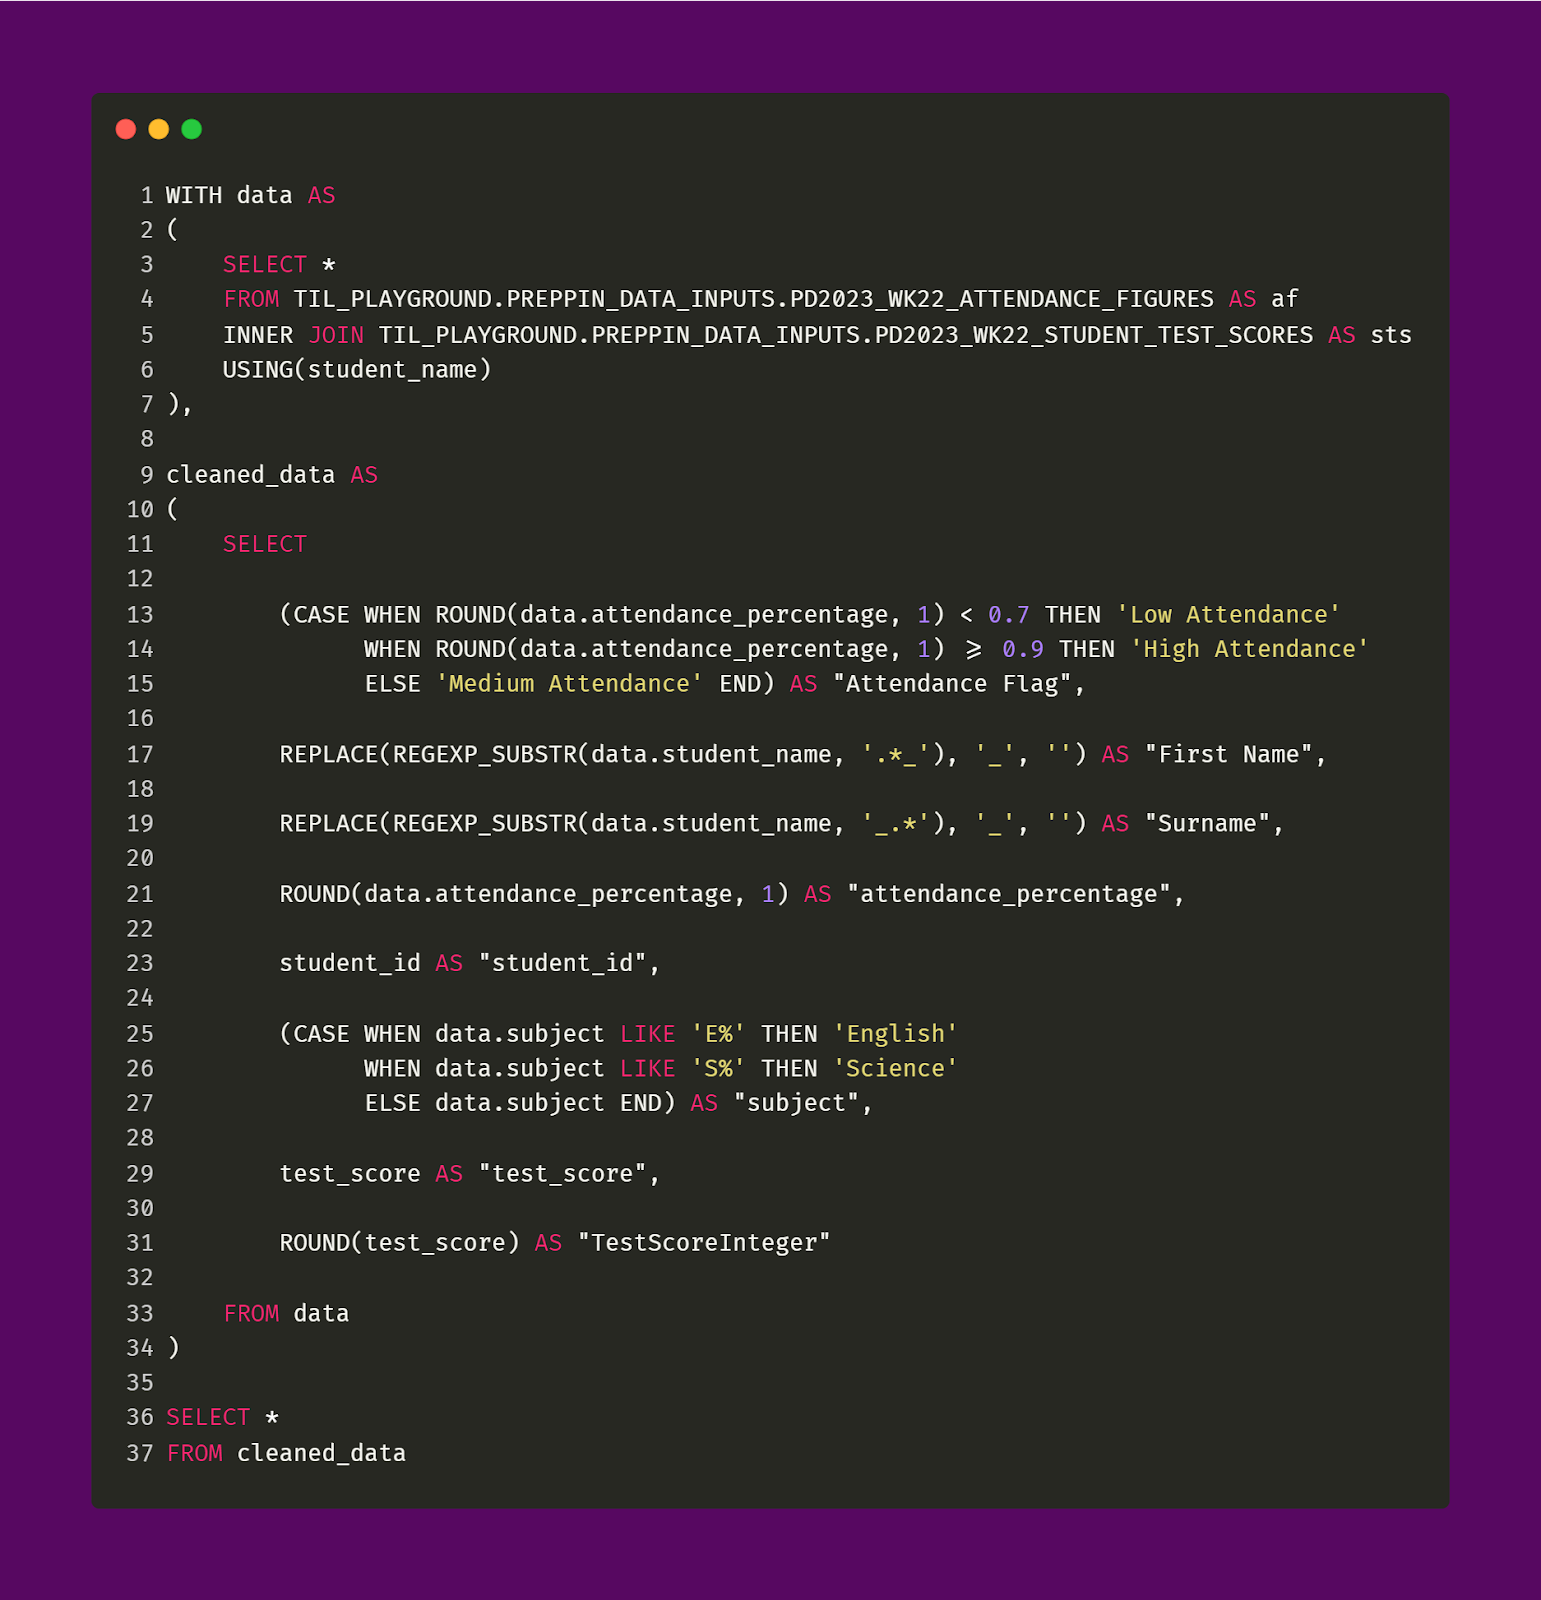
With all of that, we have done all the data cleaning that is needed. Bringing everything together, here is the SQL query that returns the desired output.
This was a really nice challenge that dealt with a lot of real-world data-cleaning use cases, such as having to split a field that contains full names into first name and surname fields or having to handle spelling mistakes. It’s amazing to learn and see how versatile SQL really is!