


— When we all saw the task this morning.. we were STRESSEDDDDD!—
Today we were tasked with analyzing the data about UK Street Crimes (Link to data)
RULES: I MUST use the API. Build an Alteryx App that allows the user to pick a date range and category and enter a postcode. The app must then render a Tableau KPI dashboard automatically.
Putting it into Alteryx:
This is the API URL I used for Alteryx
https://data.police.uk/api/crimes-street/all-crime?lat=52.629729&lng=-1.131592&date=2017-01
This workflow below is the crux of the macro that will be made
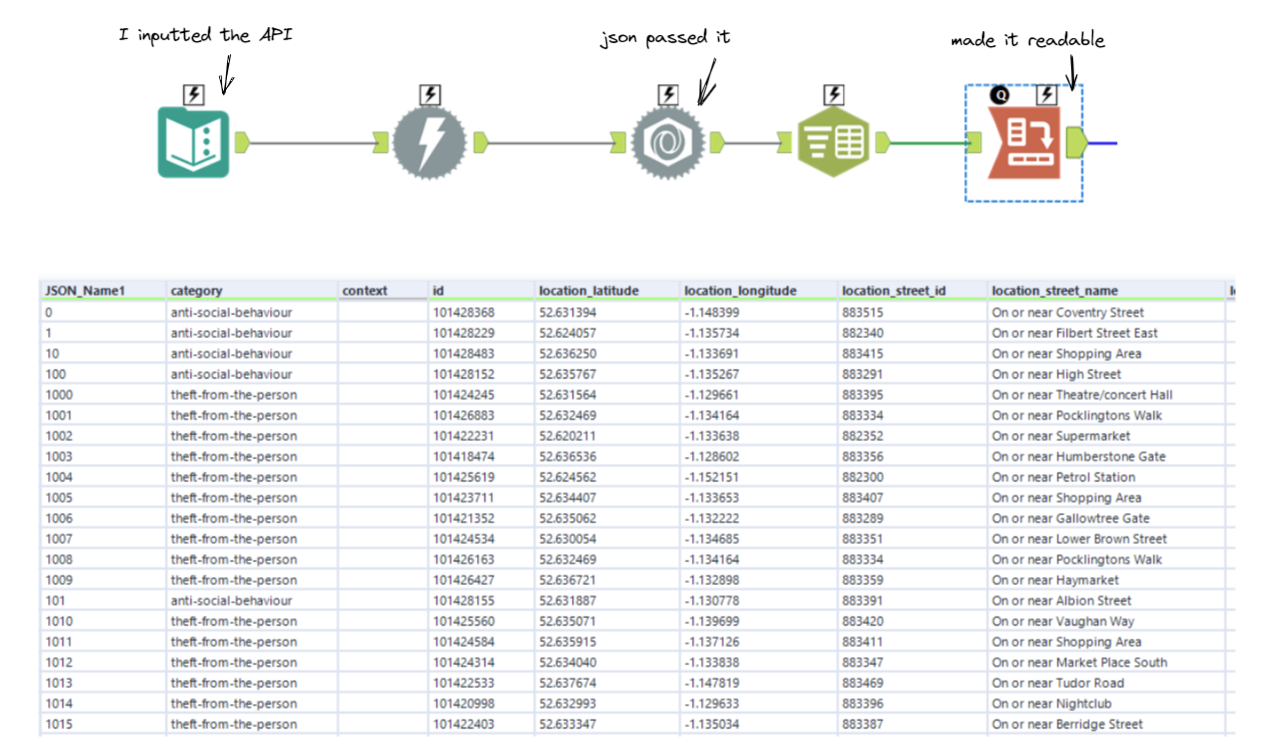
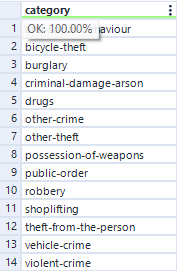
I then wanted to know how many crimes types are there so I know how many categories there are: USING SUMMARIZE TOOL
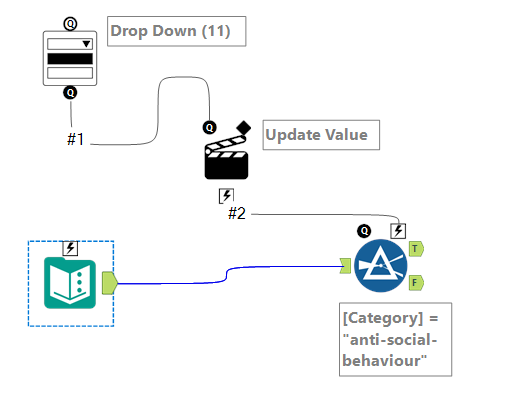
NEW ALTERYX WORKFLOW: - Category toggle
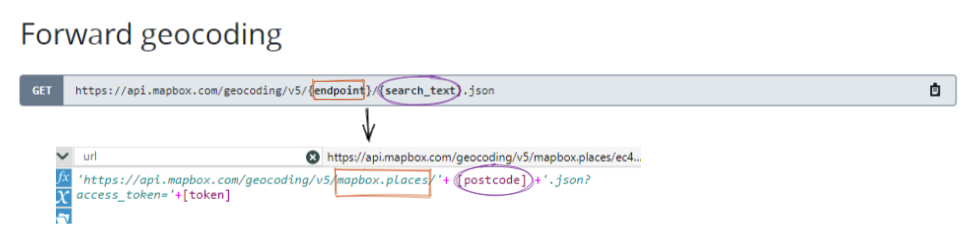
How to update postcode:
Need an account with Mapbox - get a token API from Mapbox
Also another API end points are here!
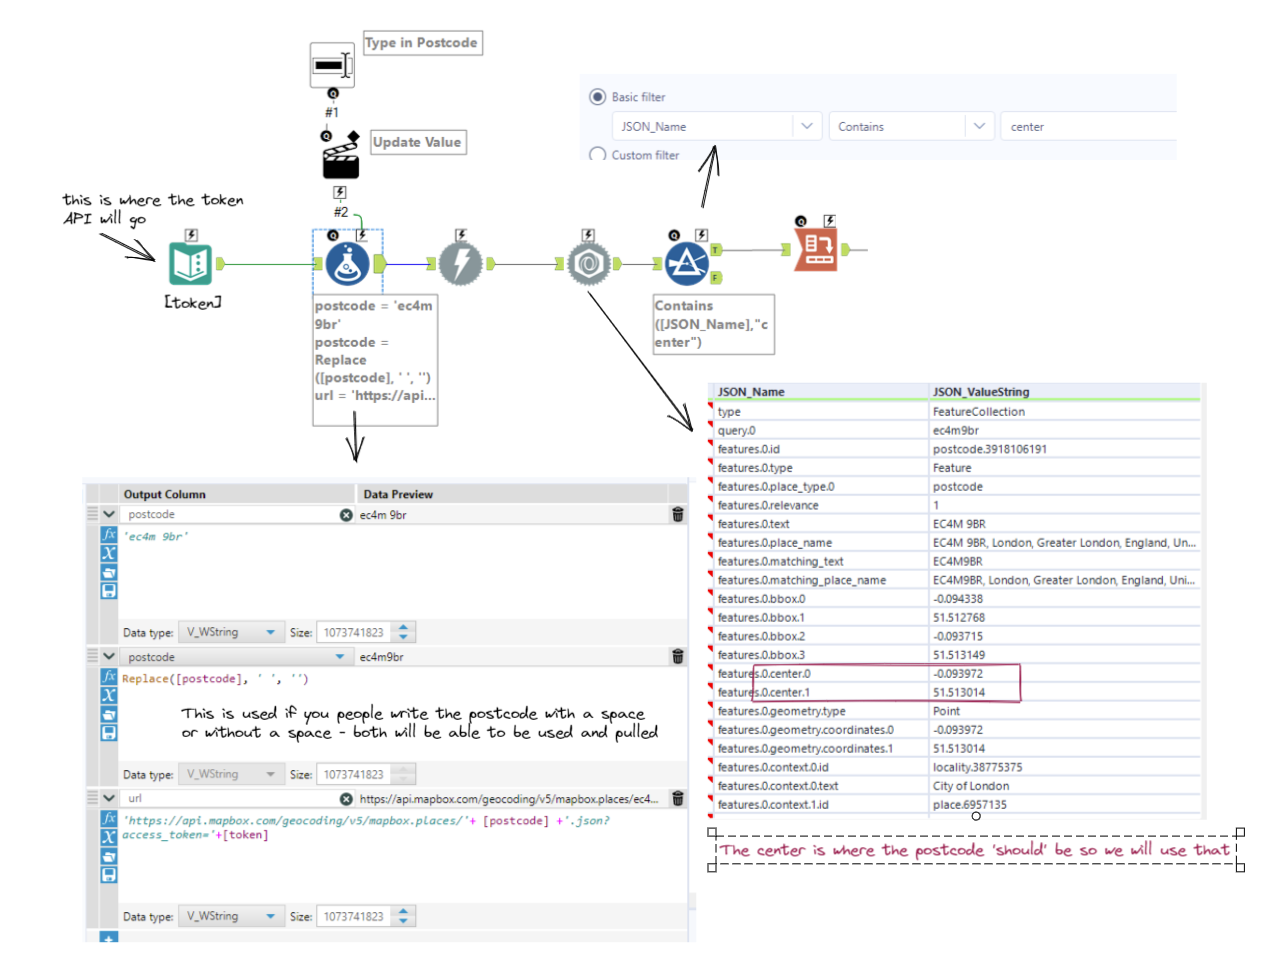
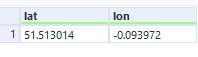
The outcome of the transpose should give you this:
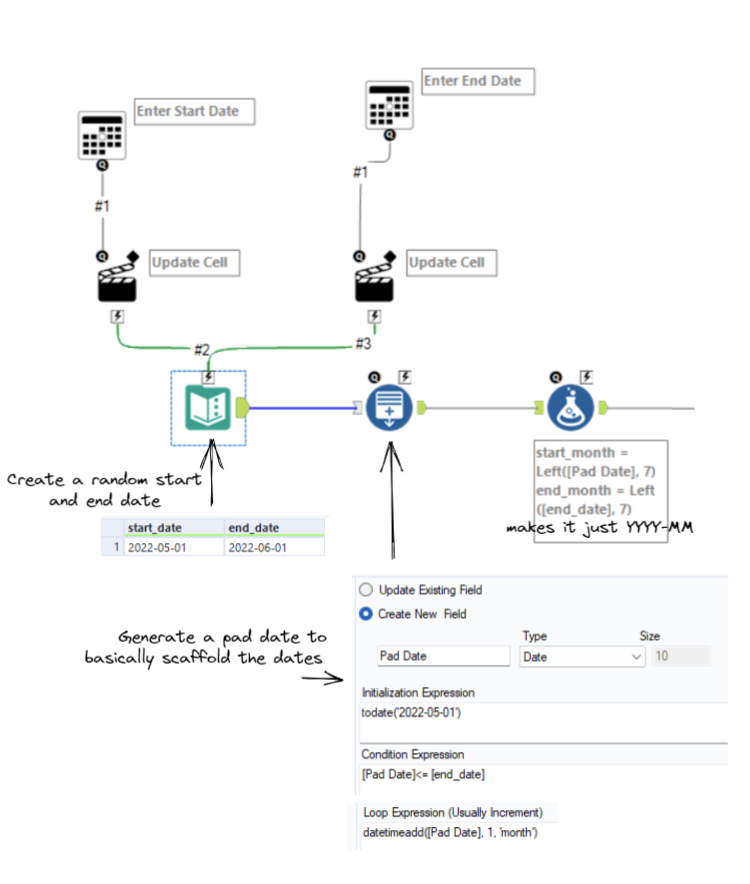
How to do the date range:
Combine them all together:
Now that all 3 toggles have been set, we need to combine them together and call that API using a batch macro (use a batch macro because of the start and end dates).
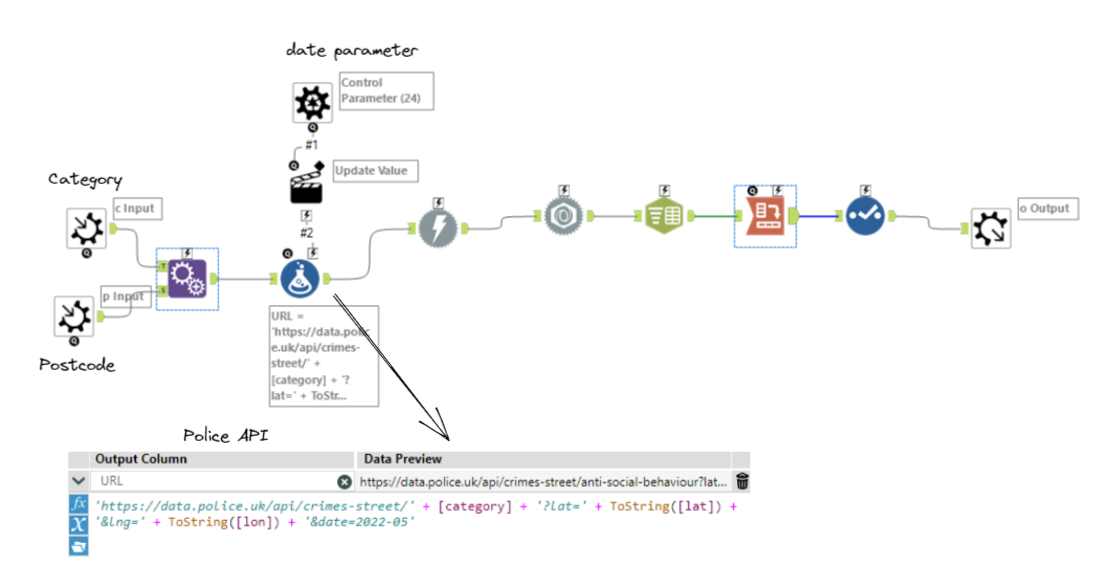
Outputting it!
Now because the task said we need to upload it to tableau public and it needs to be able to refresh depending on the control parameters of the APP.. I needed to download a new tool called the "Google Sheets Tool"
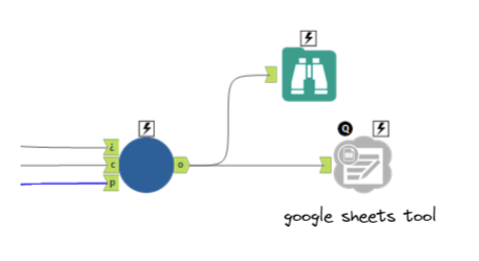
Connect to Tableau
To connect to tableau - google drive. It will then ask you to sign into your google account. Now the data of the google sheet will work in tableau.
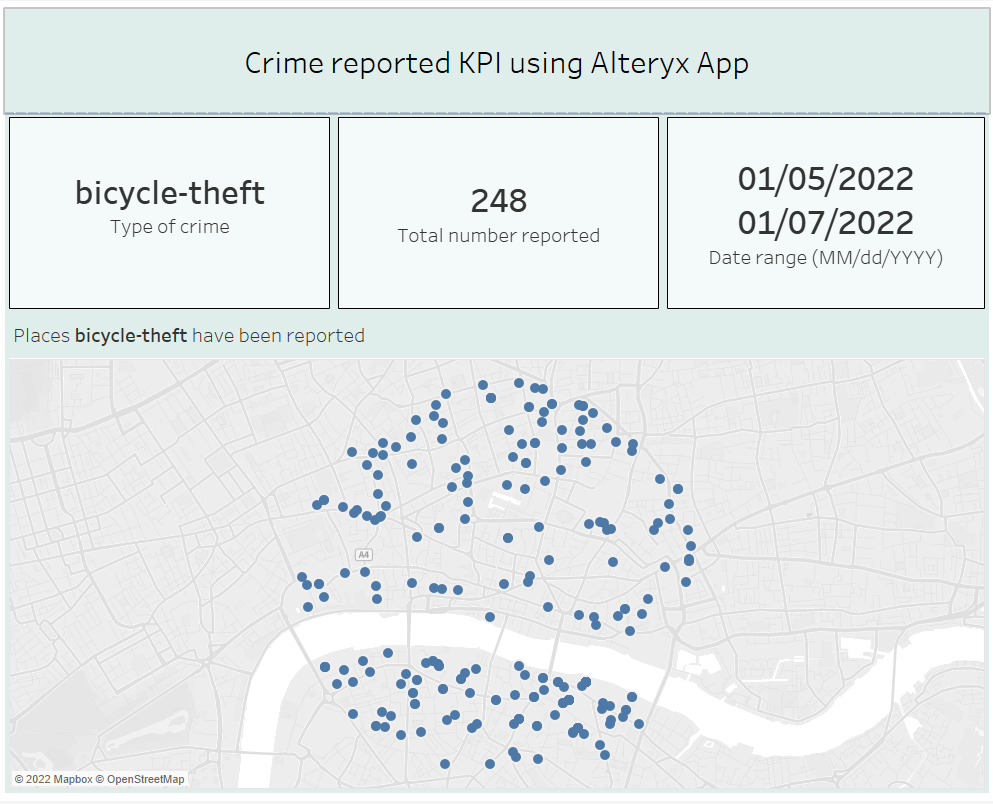
Once I created a quick KPI dashboard, I had to upload it to tableau public.
I first saved the data as an extract to then publish onto my tableau public - make sure to save as.
Because you've saved it as a google sheet - on the tableau public, this request data refresh will appear.
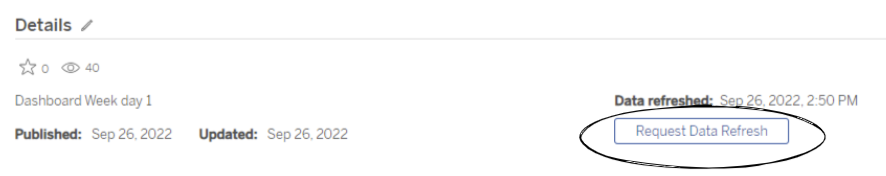
Click on this every time you have updated the Alteryx app and then refresh browser. It might take a couple reloads of the browser to show the updated dashboard.
Link to tableau public is here!