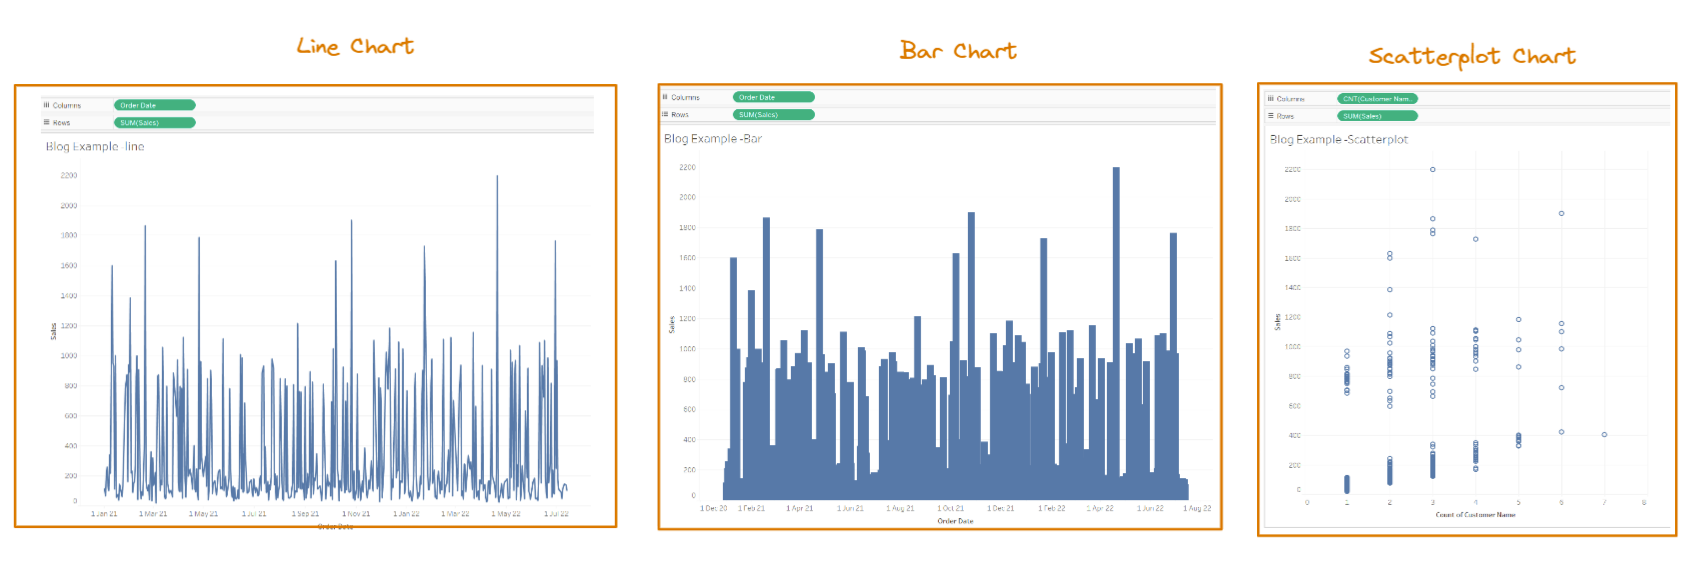
Have 3 (or however many graphs you desire)
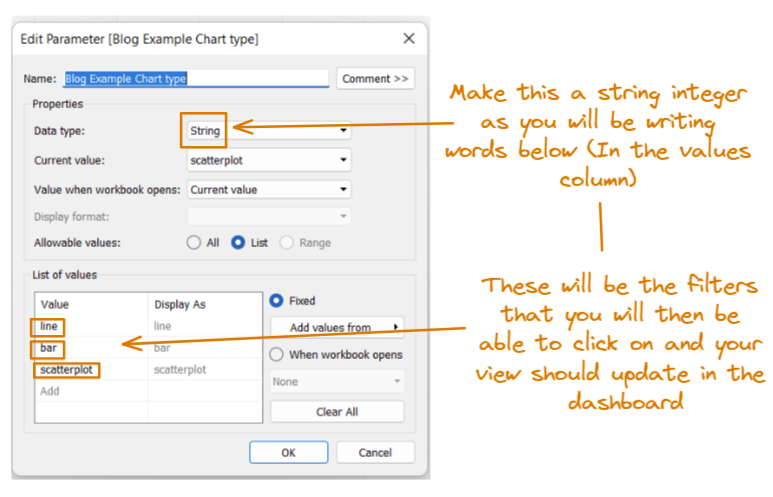
Create a parameter:
Make sure you show parameter on each tableau sheet (the 3 graphs I showed above). This is needed for when we deal with the filtering.
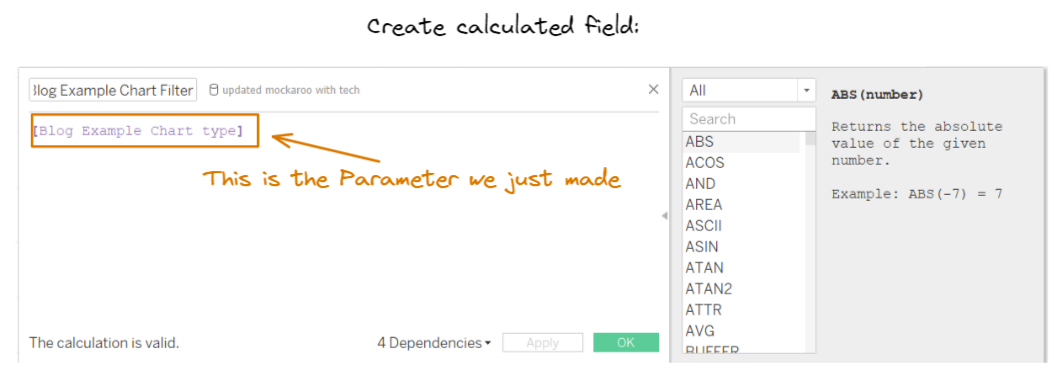
We will now need to create a calculated field so our parameter can work:
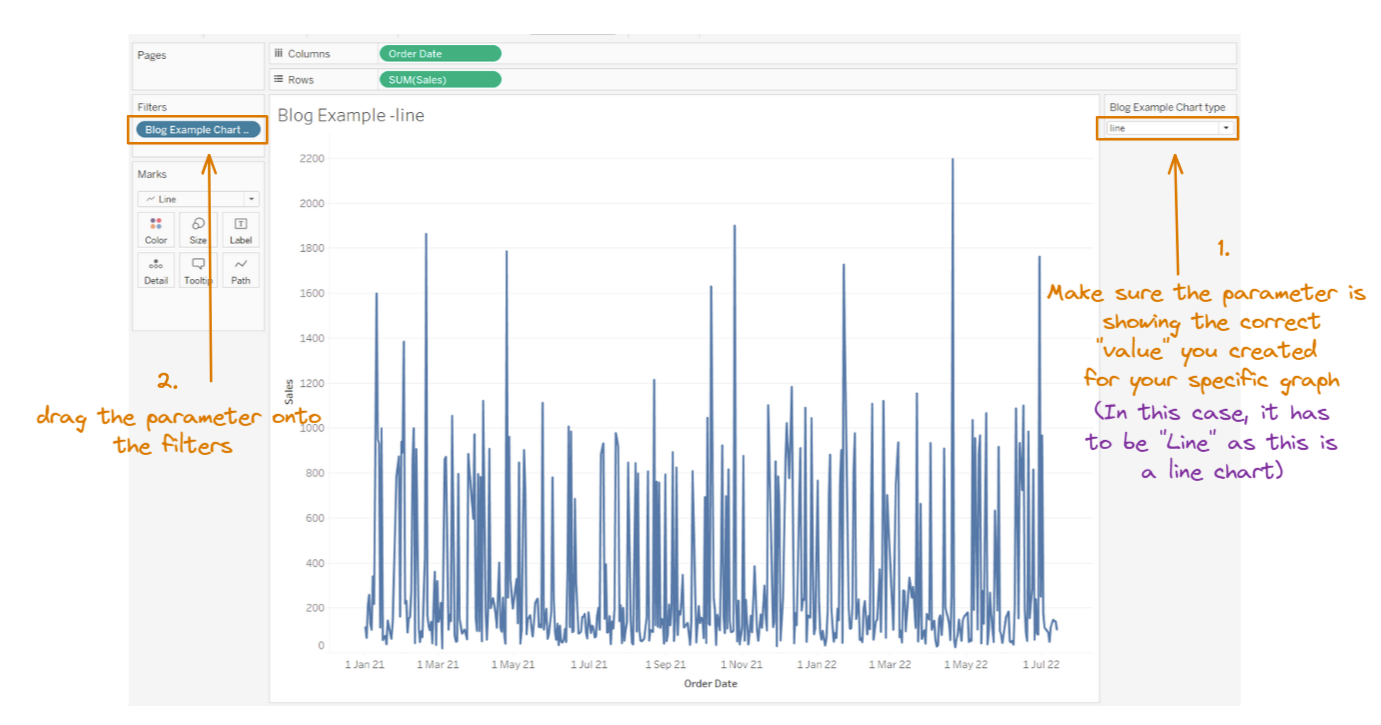
Once you have created the parameter, you will need to drag the parameter onto the filters pane for each graph/sheet you've created. Its easier to do it one graph at a time as you might get confused later on.
Now lets do the filtering!
(Remember: try do 1 sheet/chart at a time)
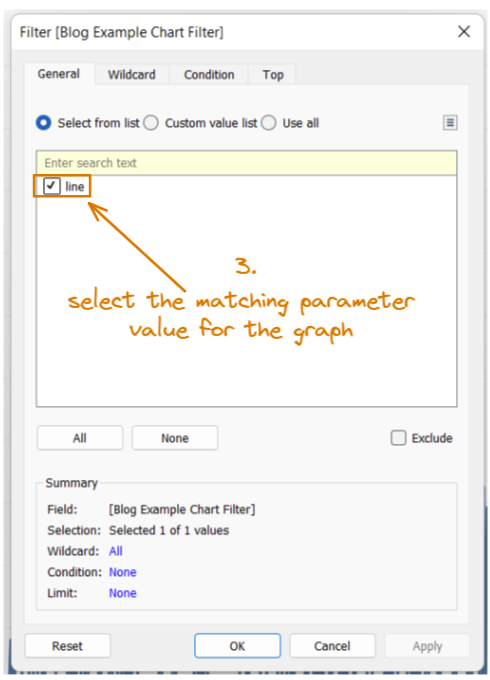
So lets start with my line chart:
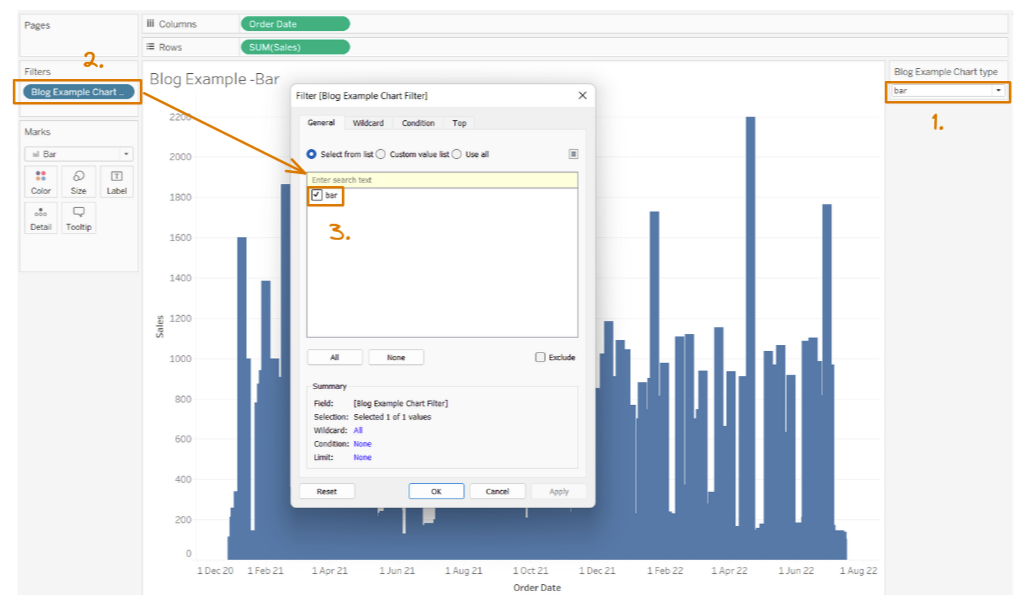
I will now show you the same process again but for the bar chart.
Do this to all the charts/sheets you want to be "collapsible" on your dashboard.
Lets check if its working:
If we are on our line chart sheet, to see if our parameter/filters are working. If we select a value that is not line, the view should go blank. Only when the value - line is selected, will the line chart show vise versa for bar chart and scatterplot graph,
Dashboard time!
Now its the fun bit! Lets make the collapsible graphs!!!
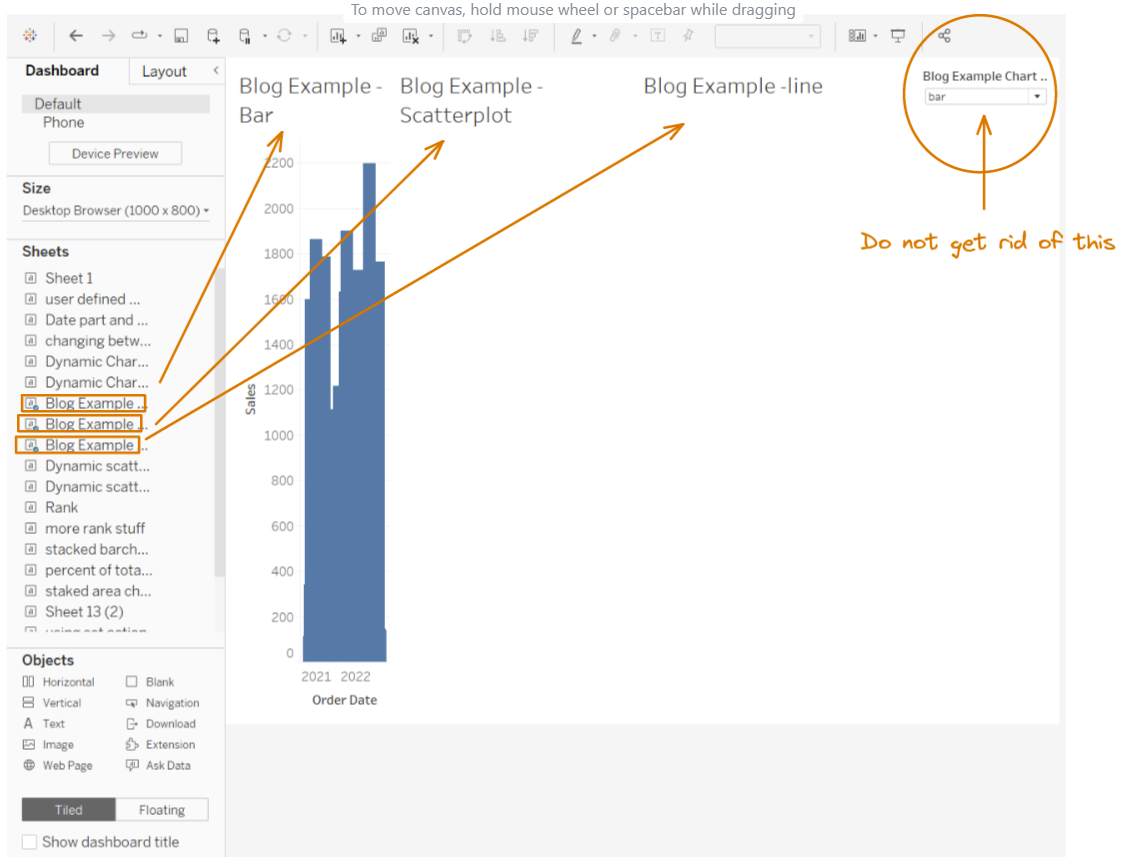
On my dashboard, I have made a horizontal container (It doesn't matter if its horizontal/vertical) and then dragged in all 3 of my graphs
Make sure you didn't get rid of the filter on the right hand corner - that is what we will be using to interchanged between graphs.
GET RID OF THE HEADERS!!!
This is the last step!! You are nearly done!
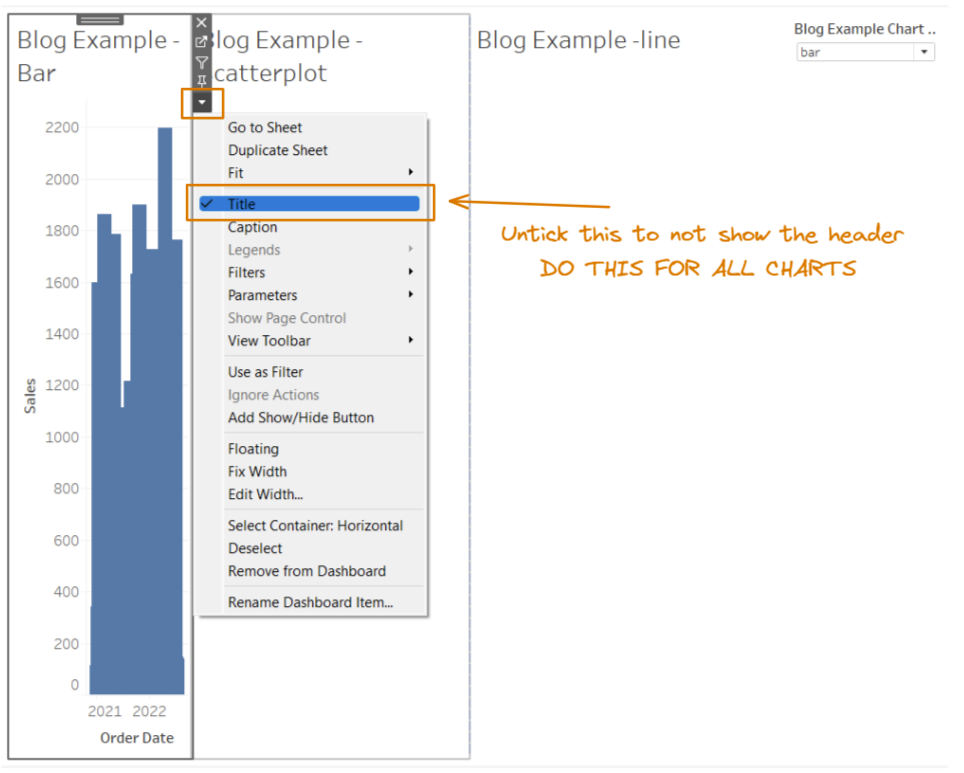
Once you get rid of all the headers in the graph containers you are done!