


Parameters help the user to interact and see specific data on their dashboard - it can also help answer specific questions the user may want. It sounds similar to filters as they both manipulate the data but at different levels.
Difference between filters vs parameters:
- Parameters change at the sheet level where the filters change at the data source level.
Filters change the view of the viz but the data also changes. A parameter however, changes the view of the viz and the data is not affected. The whole dataset is still present.
Parameters are: Superheroes floating around in space waiting for instructions.
- The Parameter does nothing until it is connected by reference lines, calculated fields, sets or filters.
Using Reference Line - Integer Parameter
I want to show a line on my graph of sales target which can be changed to any number I desire. So I first have created a parameter called "Sales Target". As you can see, once I've created the parameter and show it. it does nothing without further instruction. I then go on the analytics tab and pull out an average line onto the graph and connecting the parameter to it. Once the parameter has been connected, it now does it set function.
Now Lets Add An Action
- You can make your parameters more dynamic and interactive by using them in Parameter Actions. Parameter actions let your audience change a parameter value through direct interaction with a viz, such as clicking or selecting a mark.
To add a parameter action -> Window -> Action -> This sheet
In this example above, I have created a duel axis and synchronized them. Made one of the marks circles. Then i proceed to create the parameter action.
Using Calculated Fields - String Parameter
In this example, I want to highlight only a specific state of my choosing. I set out to create a parameter but change it to string as states are string values. I need to use a calculated field to be able to highlight this specific state by using my parameter (again, otherwise the parameter just sits there without instructions). After creating a new calculated field, I set it on colour.
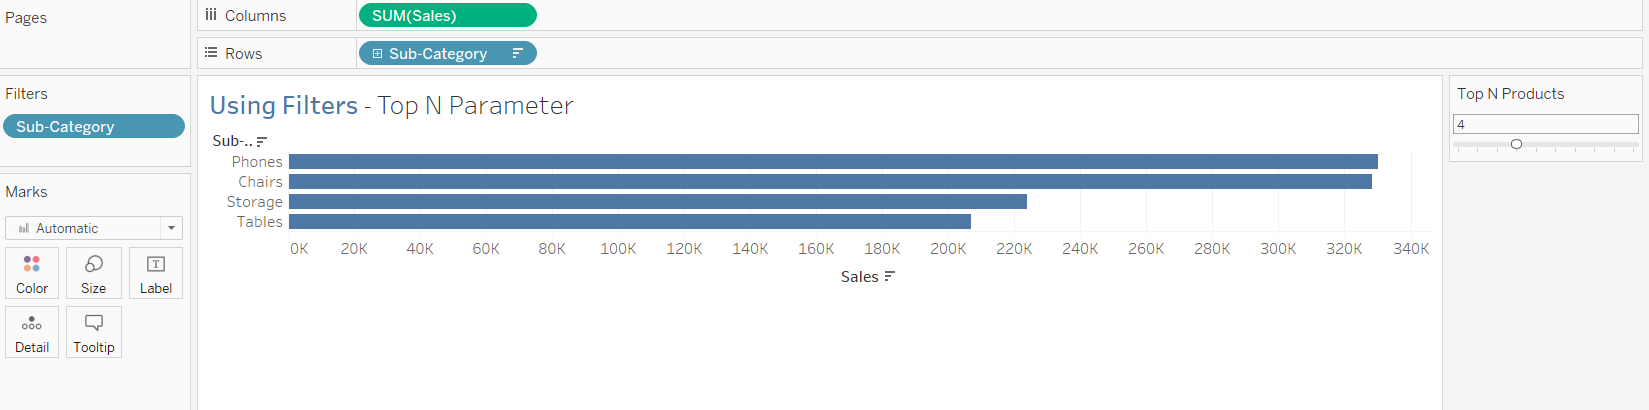
Using Filters - Top N Parameter
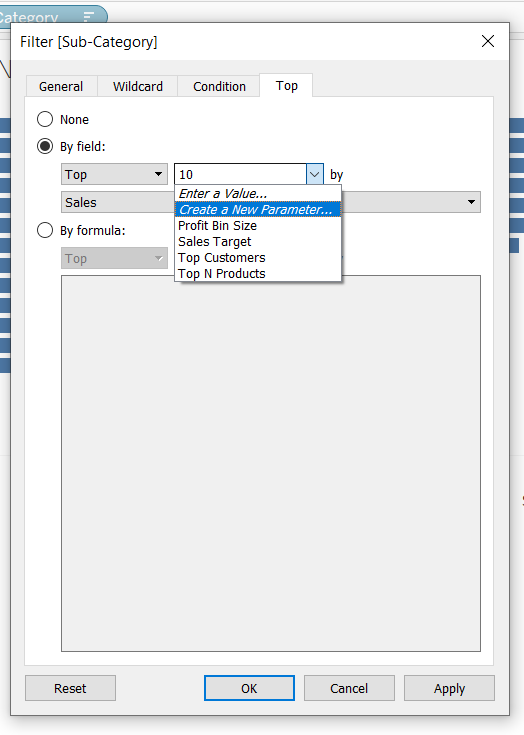
It is also possible to create parameters that show only the top N number on a bar chart. In this example, I have created the parameter in the filter. -> clicked on Use all.
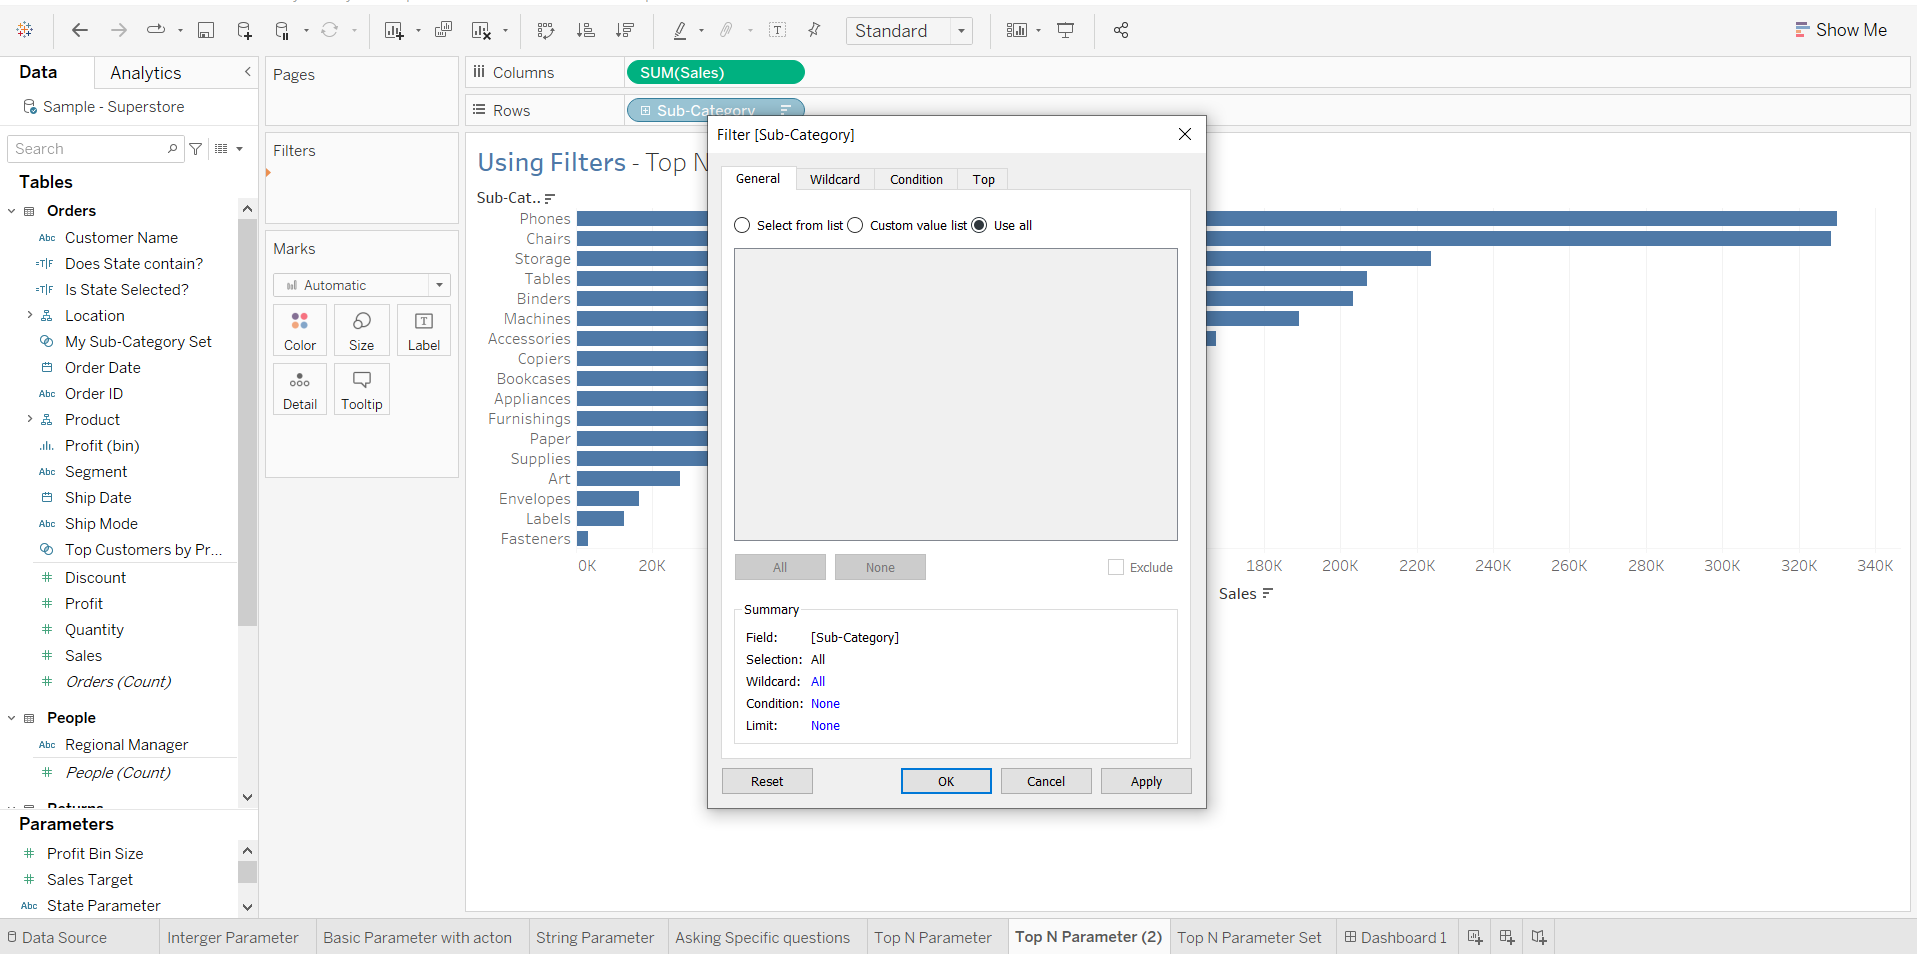
Then select the Top toggle and click -> By field -> create a new parameter
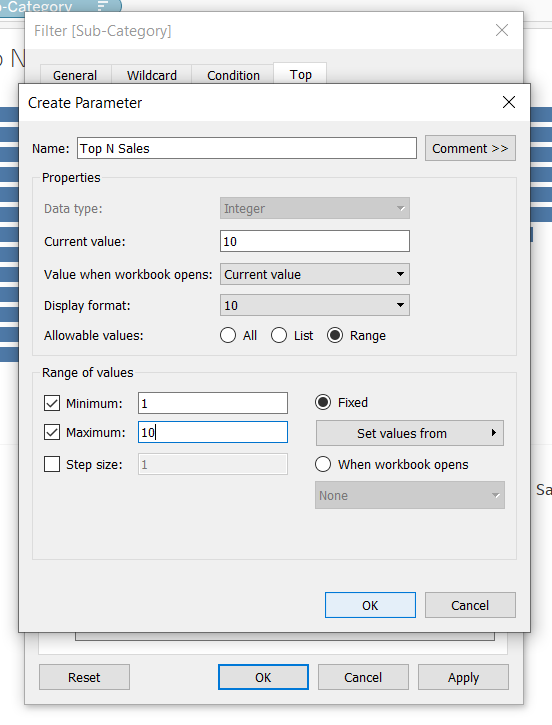
This will open up a new tab to create a new parameter. -> Rename parameter and set your desired max/min values. Click Ok
Show the parameter that you have created and you now have a Top N chart!
I have linked my tableau public viz on parameters so you can download and have a play at what I've shown.
https://public.tableau.com/app/profile/maha.hussari/viz/Project2-Parameters/Dashboard1