


Tableau allows you to cluster A Dimension based on multiple Measures in a quick and efficient way.
Step 1:
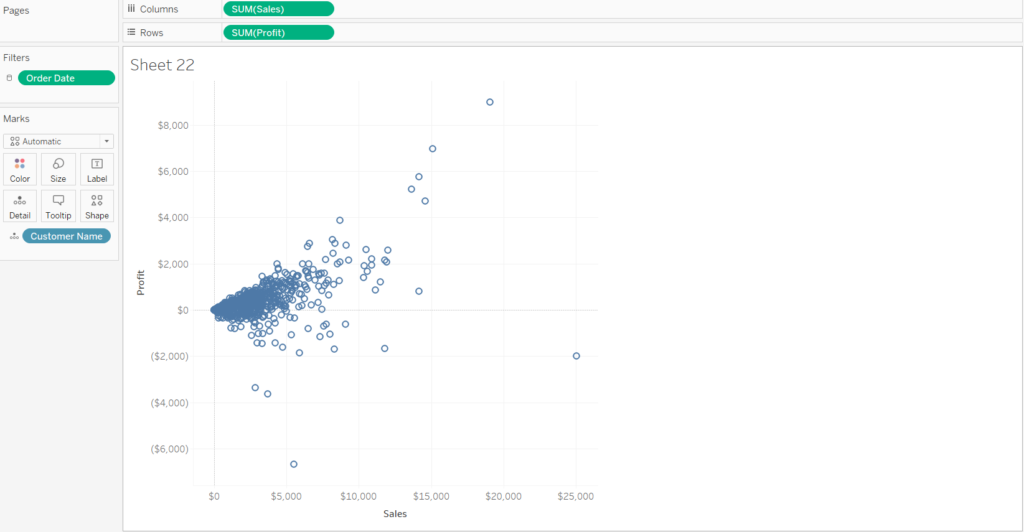
To be able to create clusters you must start with one dimension and two measures in a scatterplot diagram.
Here I have Dragged sales into the Columns shelf and Profit into the Rows Shelf and Customer Name into Details.
Once you have this view you will find that within the Analytics Panel you will have the option Clusters available.
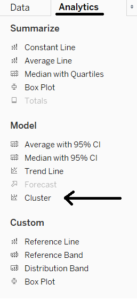
- Drag Cluster into your view and a box will appear, carrying on dragging cluster on to the little window.
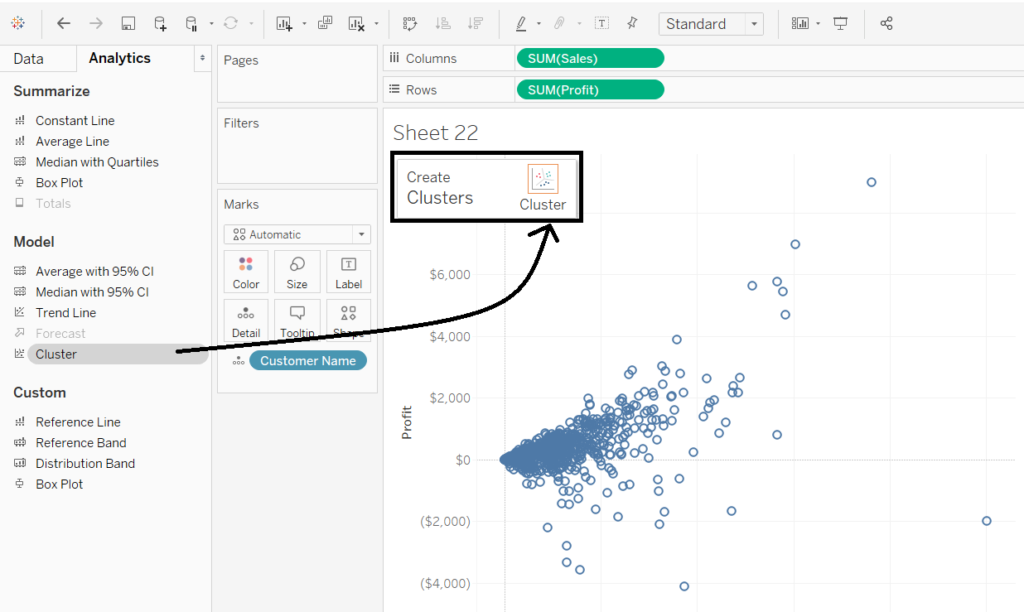
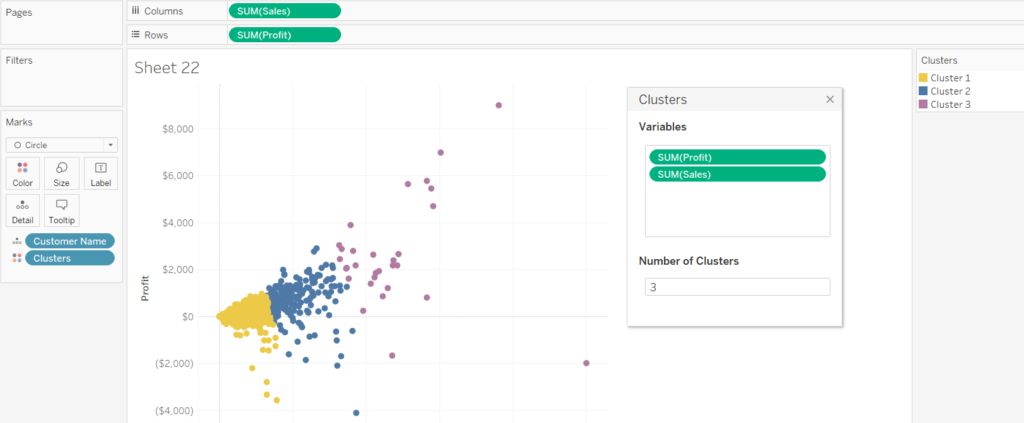
- Once you drag Cluster into the view, it will Tableau will automatically create 2 cluster groups.
This will be based on the measure you already have in your view.
A Configuration box will also appear showing you what variables are included and will allow you to choose and edit your variables.
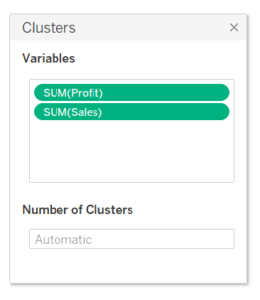
You can adjust the number of clusters to a number you prefer. And you will instantly see those changes take place on your graph behind.
Now we can also add another Measure into Variables.
Here I have added the Measure “Discount” into the variables.
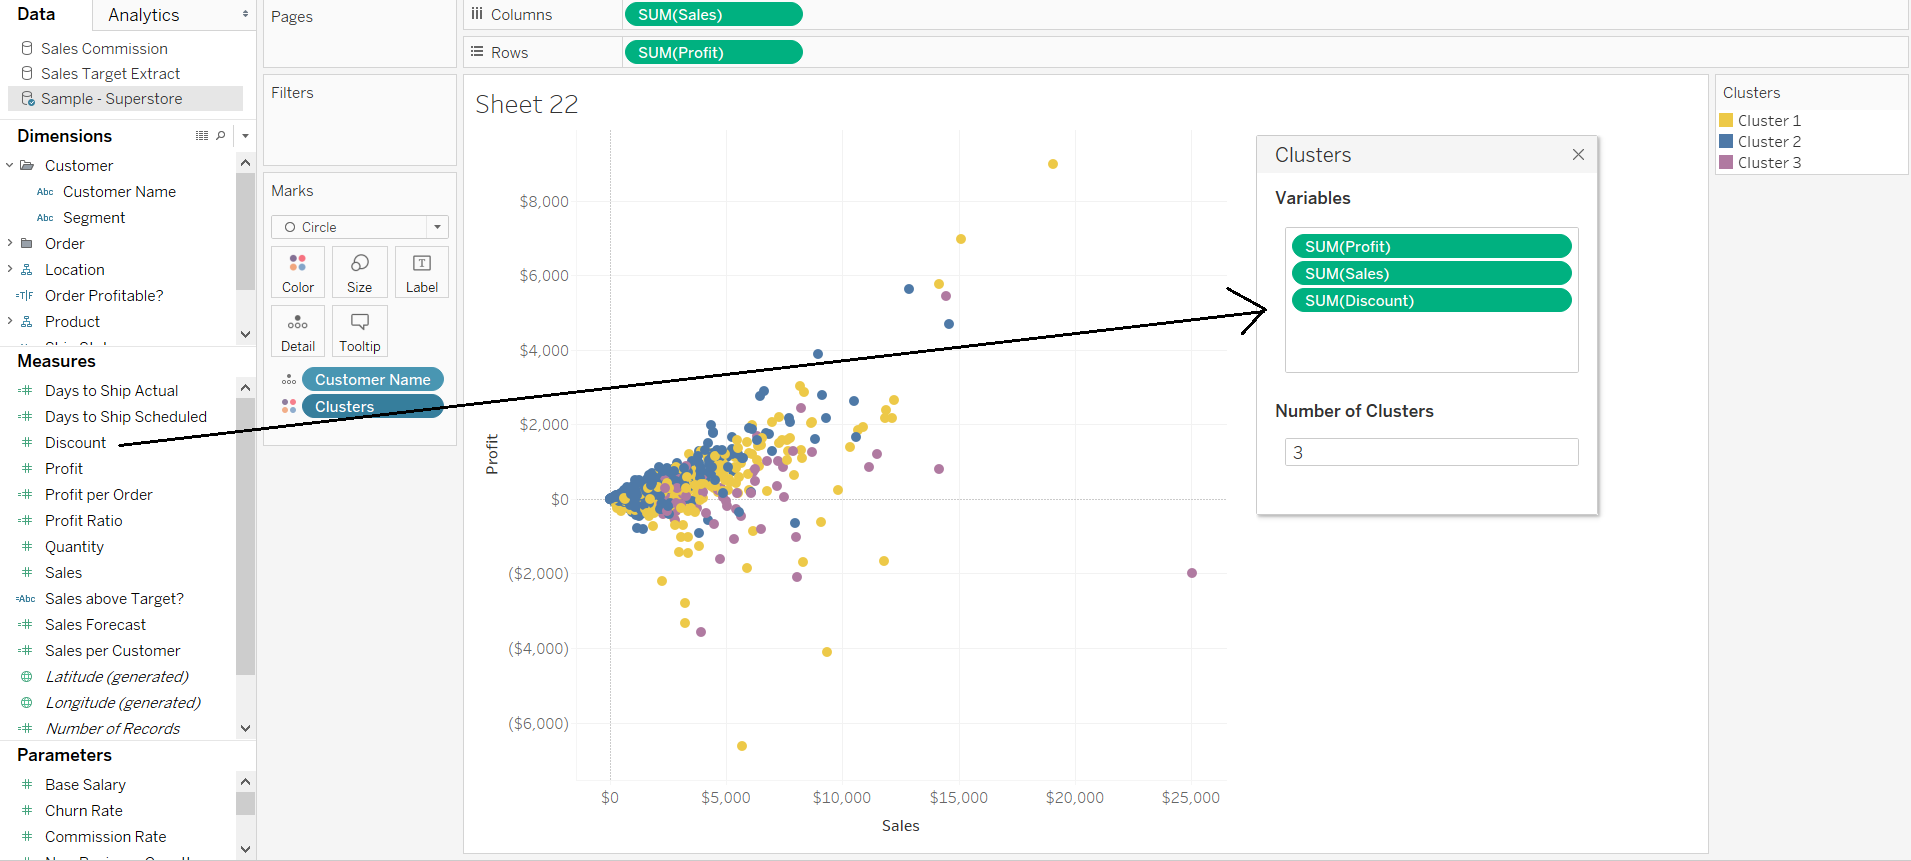
Here I have created 3 clusters of Customers (dimension), based on 3 Variables; Profit, Sales and Discount (Measures).
When you add more than two variables you will see by the colour, that dimensions will start to overlap. This is normal.