A customer retention graph allows you see how many customers come back to your company each year, from their first year of order.
I will then explain how to turn this into a percent of the total for that year.
For this example, I will be using superstore data.
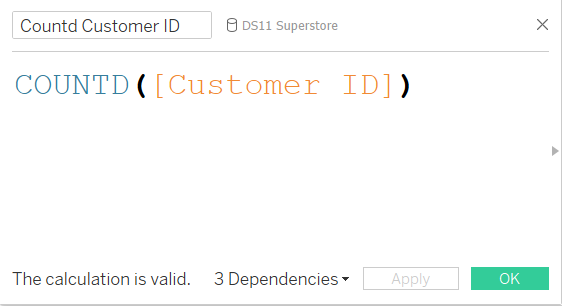
1st – Make a calculated field to count all unique Customer Id’s
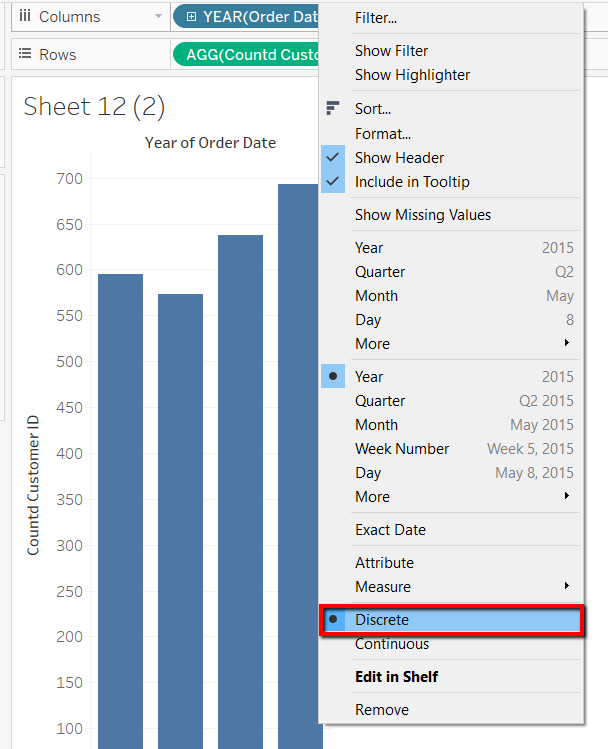
2nd – Place your date field onto columns and ‘Count Customer ID’ on to rows.
Make sure your date field ‘Order Date’ is Discrete years.
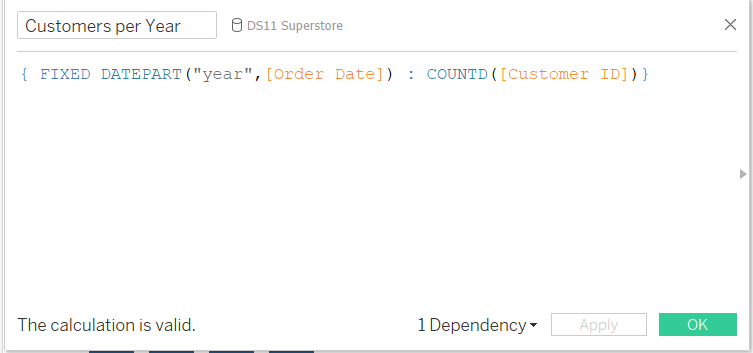
3rd– Create a calculation to find out what was the first year each customer had placed their order.
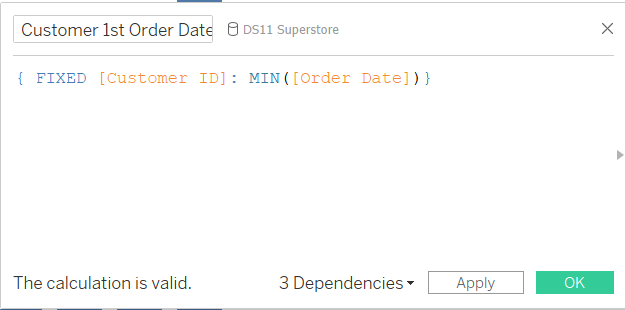
Here we are creating a Level Of Detailed Calculation (LOD), where we are aggerating our data to an individual customer level and returning our min = first order date.
4th drag this LOD on to colour
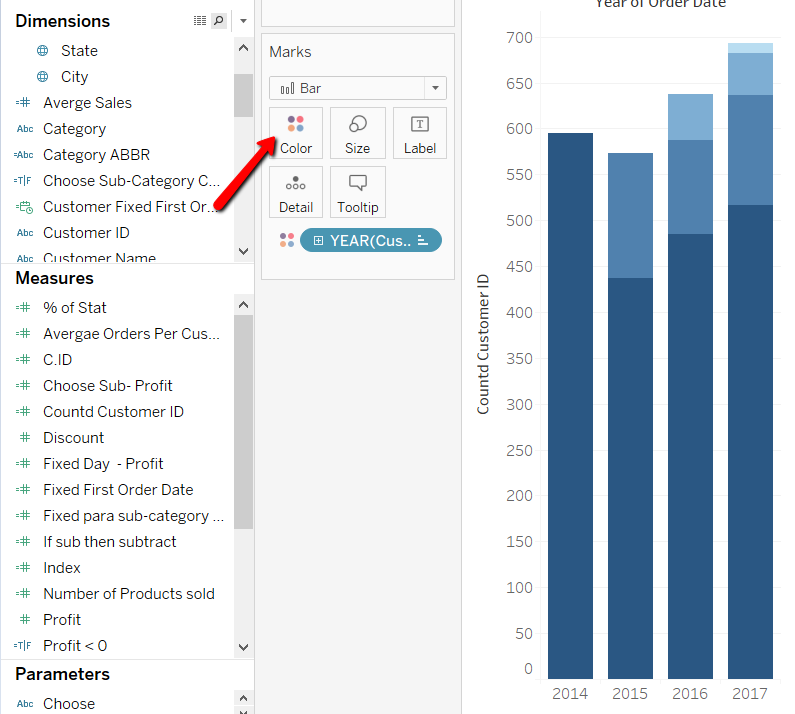
Here, if you have your date field in continuous years, you will be able to get a granular colour effect on your years, however if you want to specially pick colours for your years, make it discrete as we did above. You will then be able to pick individual colours for each year.
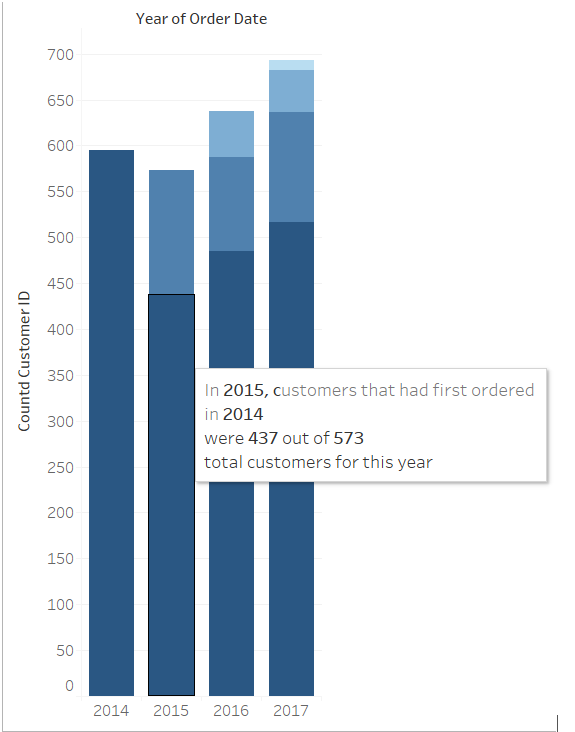
Here you have your customer retention graph. You can now add a bit more detail to your tooltips. One example, you may want to add the total number of customers per each year to your tooltips so that you can compare this number against the number to customers gained in the current year or returning customers from previous years.
This is another LOD calculation, which when aggregating the data to a yearly level, it returns the count of distinct customer that had bought something in that particular year.
If you add this calculation into the tooltip you can have something like this:
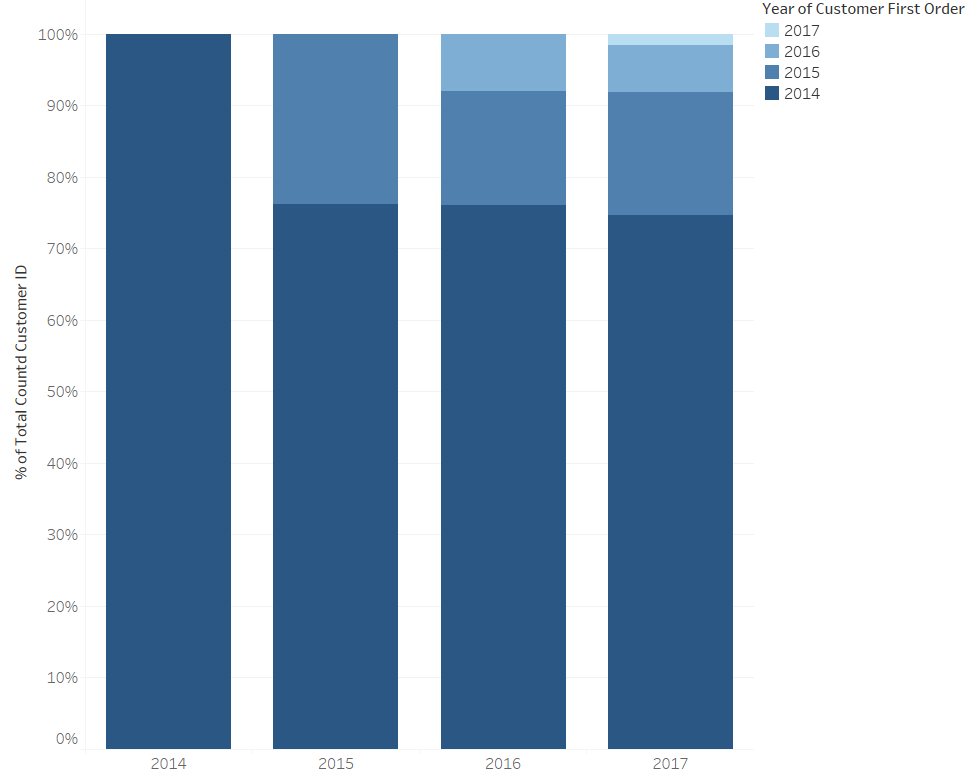
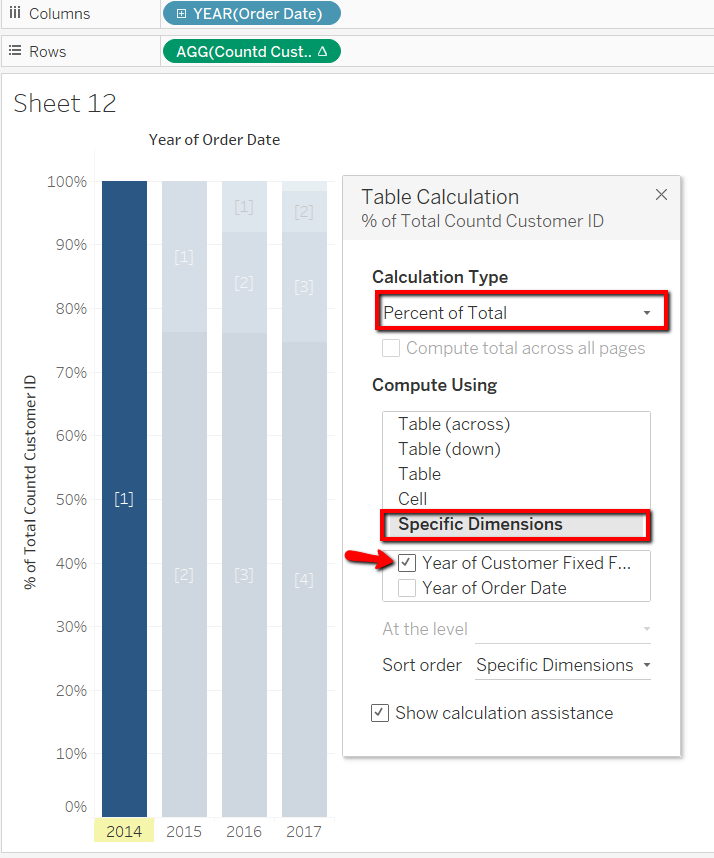
Another way to use this graph that might be of use is to create a % of total rather than an absolute number.
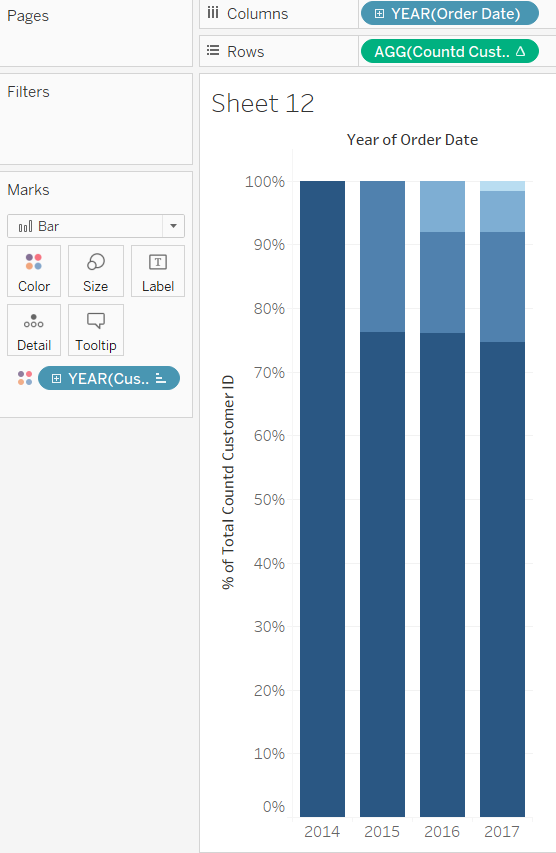
Here we can now see what percent of customer each year, where customer returning from the first year of purchase. For this table all we will need to do is add a Table Calculation to what we have so far.
Right click and add a Table Calculation to your Countd customerID calculation.
In the configuration window we will use a Percent of Total Calculation. Use specific dimensions and will use our calculation we made that calculates the first date a customer had bought something.
Final View