


For the first day of Dashboard week, we were tasked with web-scraping travel data from the Backpacker Index site to help travellers find the best-value destinations. We had to collect both summary and detailed information from each city’s page to build a dashboard that would help travellers plan their budget-friendly adventures.
The Plan
- Use Power Query to scrape the price and city name from the summary page by importing data through the HTML.
- Use Power Query to scrape the relevant tables from each city’s detailed webpage (this blog by Tim came in clutch at this stage - thank you, Tim!!!)
- Information required from the detailed pages:
- Hotel Prices
- Cost of Top Attractions (skipped due to issues detailed below)
- Cost of Transportation
- Temperature and Rainfall
- Average Price of Food and Drink
- Information required from the detailed pages:
- Use the web-scrapped data to create a PowerBI report that allows budget-conscious travellers to easily compare the prices of different travel costs across countries and cities.
Challenges
- I didn’t realise it when beginning the process of web-scraping the city’s detailed information but it turns out that the spelling of several cities on the summary webpage do not match how they are spelt in their detailed webpage URLs (the URL for Auckland used the spelling of "Aukland" etc.). This was problematic as I was scraping these names to populate the query that retrieved the detailed information, resulting in errors that were initially quite confusing to debug. However, this issue could quickly be fixed by renaming the values in my city lookup table.
- Here is the list of 'misspelt' cities for anybody who might be working on this website in the future:
- Kyiv (Summary webpage name) > Kiev (URL name)
- Shanghai > Shaghai
- Roatán-Island > Roatan-Island
- San Pedro Ambergris Caye > San Pedro Ambergris
- Auckland > Auckland
- Valletta > Valetta
- Here is the list of 'misspelt' cities for anybody who might be working on this website in the future:
- When scraping the Top Attractions information from each city, I quickly realised that the structure of the Type column often varied (a single Location could have multiple Types with multiple Prices etc.). To avoid spending too much time on this issue, I chose not to include the Top Attractions information in the final dataset.
- After selecting Apply and Save on the information I had pulled from the website, I encountered the following error: “object reference not set to an instance of an object”. Even after asking around the office, we weren’t able to find a quick solution. To fix this and get the data loaded into PowerBI, I ended up creating a blank report and copying and pasting in the tables from the original workbook. After fiddling with the privacy settings (in the Privacy section of Options, I selected “Ignore the privacy levels”), the data did eventually load successfully.
- Some processes in Power Query are exceptionally slow (taking up to 15 minutes to load a table with 700 rows???). This was perhaps the most frustrating element of this project as there was little I could do other than work on sketches and write up the blog when I didn’t have access to the data.
The Sketch
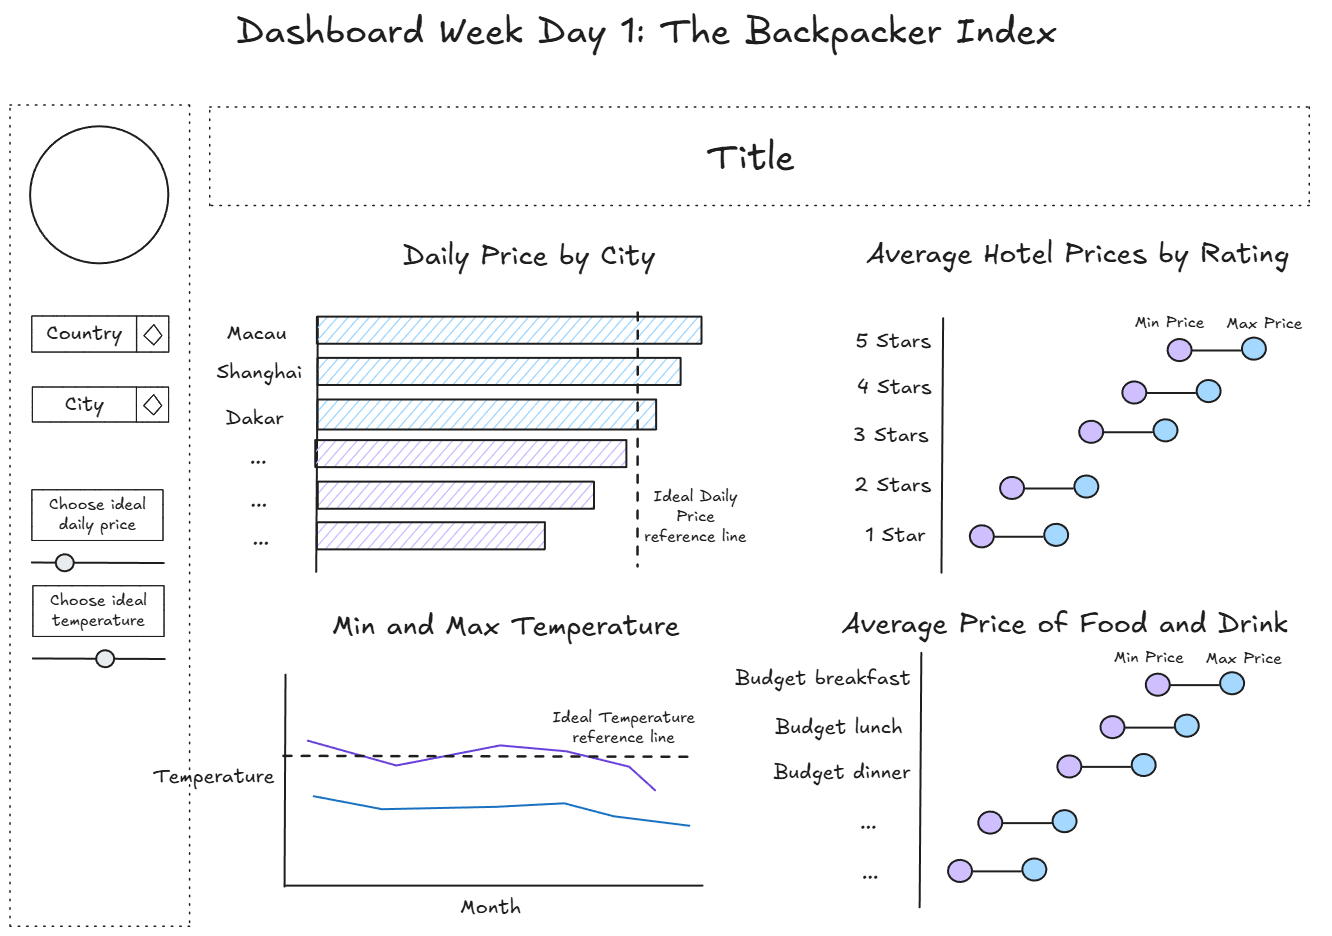
Here is a screenshot of the sketch that detailed the charts and parameters/filters I planned to include on my report:
The Report
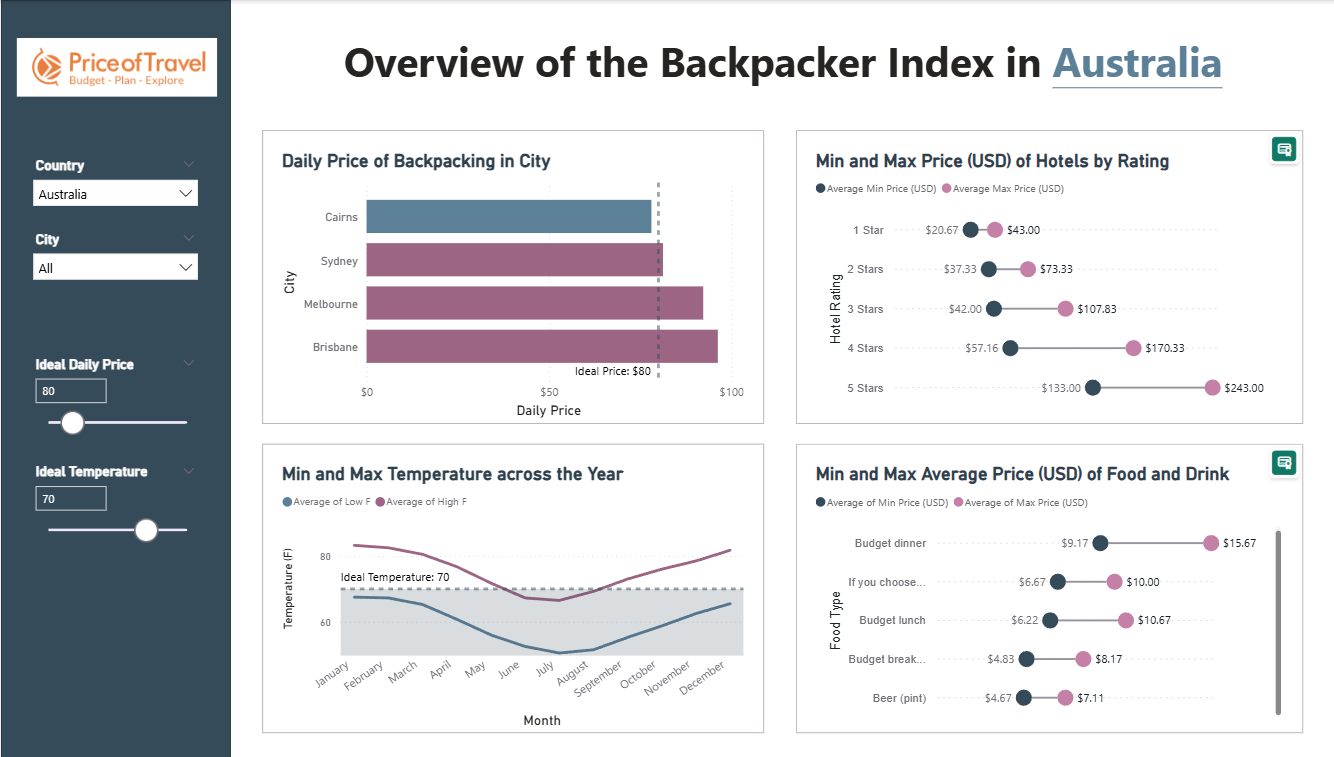
As I used a custom visualisation extension to help me create the dumbbell charts in my report, these charts are not visible when published to PowerBI as I do not have a license. I have also included a screenshot of what it should look like below.
Reflections
Overall, the first day of dashboard week was filled with many ups and downs:
- Admittedly, I am not the most confident in PowerBI so seeing that this was our visualisation software of choice this morning filled me with a certain type of dread. However, once I got over that initial feeling, I found it to be a great opportunity to revisit what we had learnt about DAX and Power Query all those weeks ago and build upon that knowledge (even though Power Query did almost drive me insane at several points during the day).
- I think I would like to have some more practice with web-scraping as this is a skill that I think would be particularly useful for some personal projects I have in the making (stay tuned!!!). I did see others in my cohort using Alteryx for the data preparation stage of this project and I wonder whether or not I could have mitigated some of the issues I faced today (specifically Power Query being slow) if I had taken this approach.
- Last but not least, this was a nice reminder of just how far we have all come in just 4 months. It feels just like yesterday when DS52 and I were stressing over our Friday Projects where we just had to sketch and plan out our dashboards in 6 hours - just wait until you have to do all that and data prep in the same amount of time!
Roll on the rest of dashboard week!