


One tool that anybody interested in data analytics will find invaluable is Excalidraw. Excalidraw is basically a virtual whiteboard where you can create diagrams and collaborate with others in real-time. It’s pretty user-friendly with plenty of keyboard shortcuts that can be learnt to speed things up during sketching.
However, it should be noted that everything is stored locally (i.e. to your browser) so it is important that you back up important sketches frequently. This can be done by saving the canvas to an Excalidraw file which can later be imported back in and edited.
Excalidraw for Sketching
The most common use of Excalidraw for a data analytics consultant would be sketching out your charts and dashboards. Personally, I always find it easier to spot silly mistakes in my viz ideas once it's down on paper (or the screen). Some other bonuses of having everything digital is that you can easily copy and paste repeated elements as well as edit existing elements without much hassle.
If you want to save time, you can also add preset libraries to Excalidraw - these are collections of graphics others have created that you can simply drag and drop into your own canvas. One that I recommend for sketching dashboards is the Data Viz library by dbs-sticky. For example, this bar chart heatmap only took me a few minutes (compared to the however dozen many minutes required if I were to make all those bars and squares manually):
Excalidraw for Planning
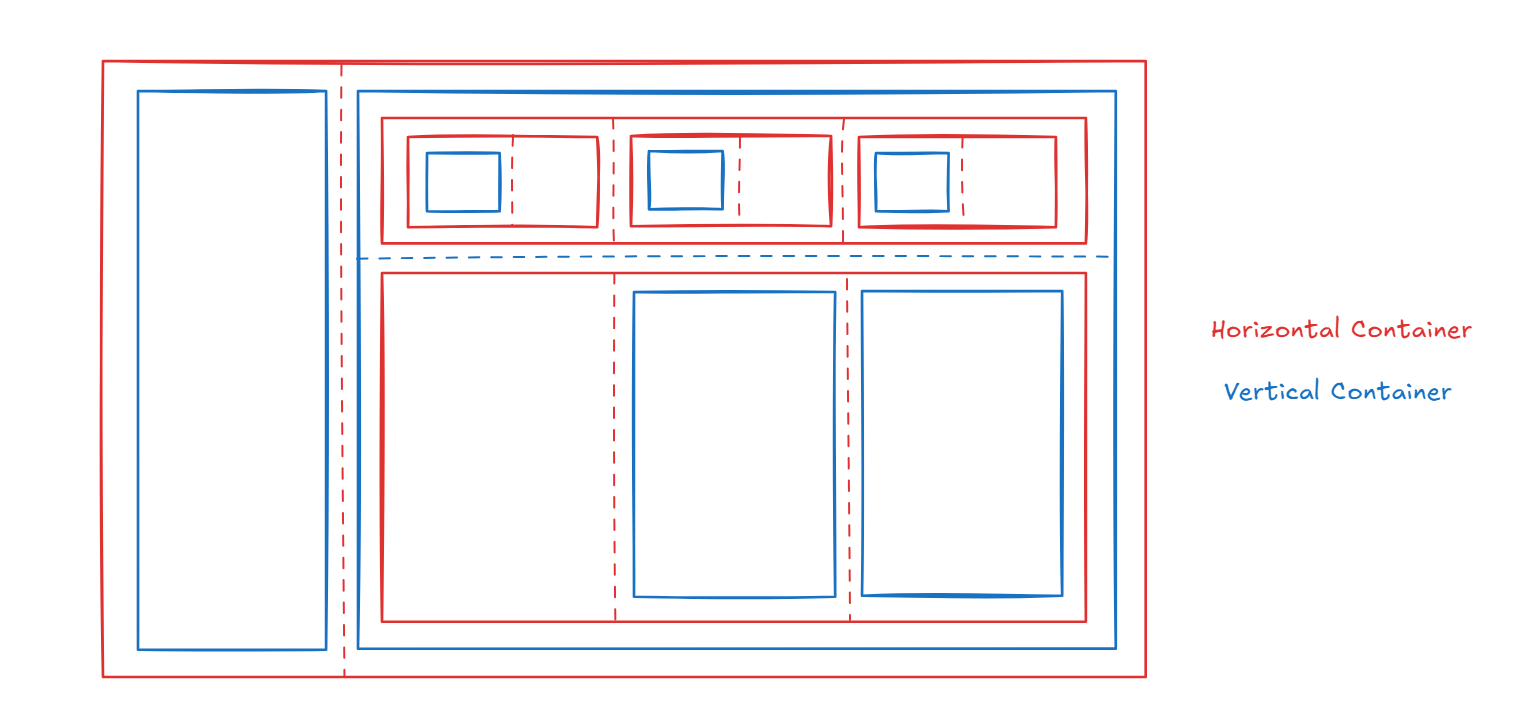
Excalidraw can also be used for planning out the layout of your dashboards. One particular aspect of this that I find particularly useful is the ability to visualise the containers that you will use. It can be quite frustrating to try and figure this out on the go in Tableau Desktop so taking a couple of minutes to sketch it out can save you a lot of headaches in the future (trust me on this one!).
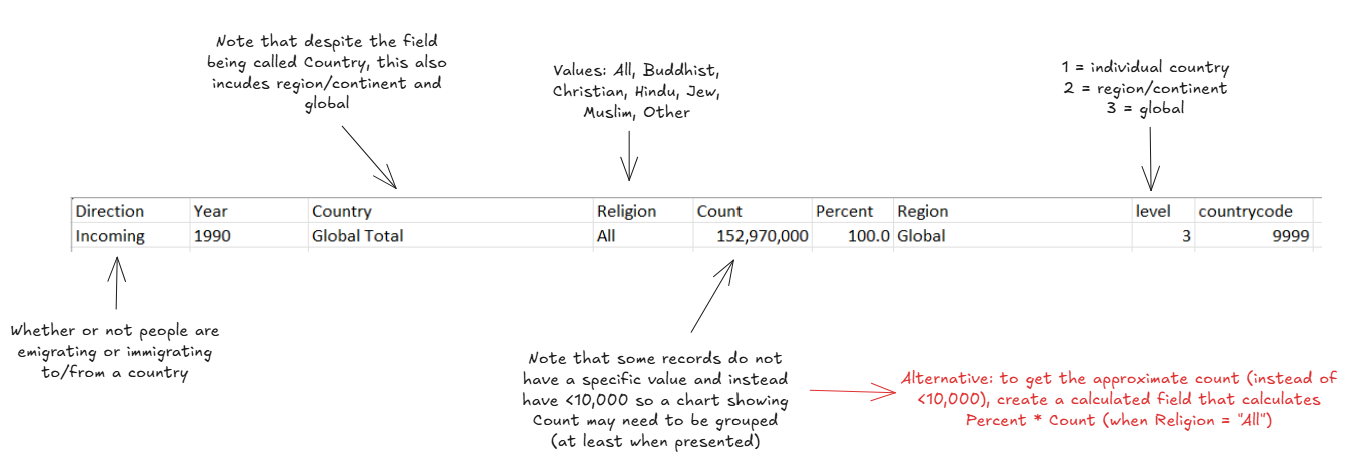
Another way that Excalidraw can be used during the planning stages is for helping with data exploration. For example, when you are looking at a dataset for the first time, it can help to screenshot the headers and some example fields so you can easily annotate the fields with key observations and notes for later. Some may prefer to complete this in Excel or Google Docs for the sake of efficiency and transferability but this hands-on method tends to work for me better.
Overall, this is only a small sampling of the things that can be achieved in Excalidraw. The best thing about it is that it is not only useful but also fun, so I encourage you all to go out and try it for yourself!