


Day 3 of Dashboard Week is almost over!
And we’ve finally discovered what Andy had meant by “Wednesday is going to be interesting”.
Today is the day of…Microsoft Power BI!
Do you know all Microsoft products?
If you have a look at Microsoft’s main page, Power BI appears among the Productivity tools, together with Skype for Business and Office 365.
Power BI is a business analytics service provided by Microsoft.
If you have done some reporting, you might have heard about it and used it.
Why using Power BI at the Data School?
Training at the Data School mainly revolves around two analytics solutions, Tableau and Alteryx.
However, the entire training and the two years that follow aim to turn you into a well-rounded analyst, trainer, and consultant. In short, someone who’s able to address various types of client requests and pick up new skills very quickly.
Let’s learn something new

I personally love learning new tools.
I have realized that the fastest way to get comfortable with something new is having some kind of challenge to tackle right away and banging your head on the wall until you’ve figured out a way to solve it.
An example?
I wanted to draft a proper report, so I installed a trial version of Adobe Illustrator and learned as much as I could in that timeframe. Then, I published my first report.
I needed to visualize the data for my organization, so I started exploring all kinds of WordPress plugins and Drupal modules.
I had no clue about what to use to create the interactive dashboards that I had often seen online. I found that some plugins weren’t compatible with Elementor, the pages kept on crashing, so I scrolled through some Udacity courses and learned about Tableau.
That’s how everything started.
And that’s also how I slowly became aware of the complex infrastructure behind the analytics dashboards of some famous websites or of the social media platforms that everyone knows.
The Gartner quadrant: How are Tableau and Power BI positioned?
I come from a nonprofit background, so I wasn’t aware of a lot of business debates. I have learned only recently about the Gartner quadrant, which is the best tool to assess where technology players are positioned within a specific market.
Tableau and Power BI dominate this sector, as they are the top two companies in the world of data analytics.
Of course, there are many other resources and articles online to decide what’s best for you.
This is not supposed to be the most comprehensive article on the topic!
It’s just a summary of what I have learned and struggled with after playing with a new product for just a few hours.
However, it took a very short amount of time to figure out how both tools are configured for different purposes.
Tableau, yes, is 10 years ahead, but it’s also more suitable for larger, more structured organizations that need a robust system to work with different data sources and conduct advanced analysis and that might want it installed either in the cloud or an on-premise server, etc.
Power BI seems much more suitable for an organization that needs to do reporting fast using a simple and accessible solution.
It might also be great for executives and people who neither need to dig too deep in more complex calculations nor conduct a robust analysis.
For this, Tableau seems a better choice.
I would imagine Tableau being used by more structured companies or complex organizations such as universities, where a team of people is dedicated to managing big datasets, analyzing complex data, and visualizing results in reports and dashboards as part of a long-term strategy.
Again, this was my first impression.
Today’s dataset: US H.E. institutions. Foreign Gifts and Contracts
The dataset today was very clean and didn’t require any data cleaning.
It was very interesting to explore these flows of resources from countries I didn’t expect to find in the list and from organizations that I have been following for some time.
I found 3ie, the International Initiative for Impact Evaluation, and the Qatar Foundation, which awards many grants in the education sector.
Power BI: 5 things I struggled with
Today, I tried to follow some basic steps to get comfortable with the new product.
As usual, we were all able to quickly find some introductory documentation and lots of Youtube videos.
At first, I tried to follow a logical order. However, I soon found myself importing the Excel file to Power BI, picking a few chart types from the list, importing new ones, playing and tweaking with the features to get the logic of it one step (or better, mistake) at a time.
One thing’s for sure: it’s very different from Tableau.
As someone who’s spent quite a lot of time with Tableau recently, here’s my list of the top 5 things I struggled with the most.
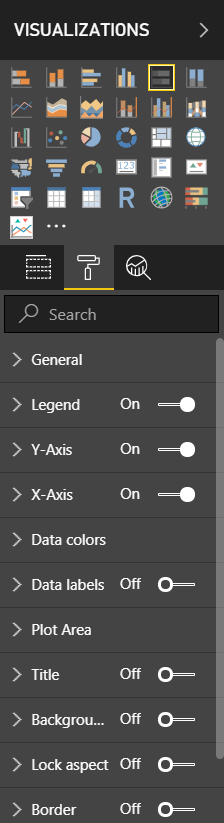
1. Formatting.
I found it very hard to move around the Visualizations pane and figure out a quick way to change the format for each chart.
In order to change the format of the fields themselves, e.g. adding $ to the numberic value, you have to go to the tables themselves here:
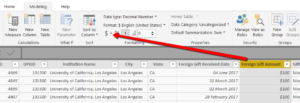
click on a field in the table and then change the format.
2. Can I create calculated fields?
I was a bit confused while watching the training videos online. I didn’t get how many (and what type of) calculations I could actually do on Power BI and what, instead, I should create in the Excel file itself before importing it to Power BI.
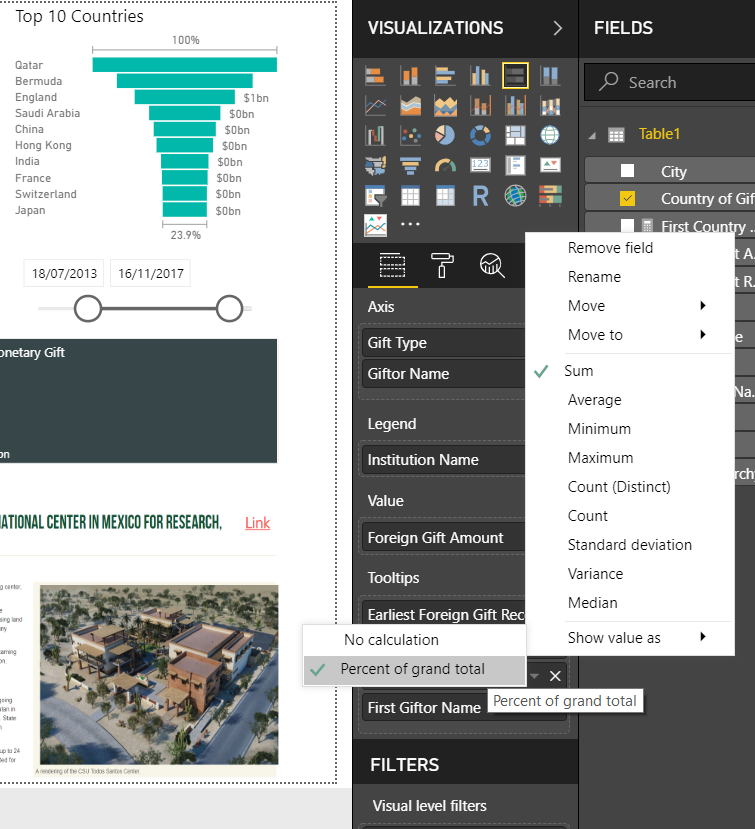
I also needed to create some LODs to change the percentage of total in some charts and I struggled with that as well.
I found the “Percent of grand total” but I couldn’t find the LOD alternative in Power BI in the time available.
Everything seemed a bit limiting on this front. Instead, this is the one of Tableau’s core strengths.
I think that this was the most frustrating aspect.
I didn’t find Power BI as powerful as Tableau and I could never move from one to the other.
3. Show me (chart types). You can’t stop there.
Since the day I’ve started using Tableau, I’ve never used the “Show me” option. I’ve tried to learn how to create charts from scratch.
Here we often say that the “Show me” option is a bit like cheating. The best thing is to learn how to make them on your own.
Power BI is designed with the opposite purpose in mind, I think. For people who want to:
- import their datasets,
- pick the chart types that they want and
- see them appear on the screen.
Tableau offers all these features, too.
Look to the right of the screen and the Show me option is right there, with lots of different chart types.
However, if you want to bring your data analytics skills to the next level, you definitely can’t stop there.
Today, I wanted to be free to experiment and customize charts the way I’m used to.
4. Where is Fit ==> “Entire view”?
When you build a dashboard in Tableau, you can select an option called Fit ==> Entire view.
It allows you to see the entire chart in the space available.
On Power BI, I had a very wide bar chart and I couldn’t find a way to fit all the values in the view. I had to scroll on the right to see the rest of it.
There’s likely to be an answer to this issue, but I couldn’t find it.
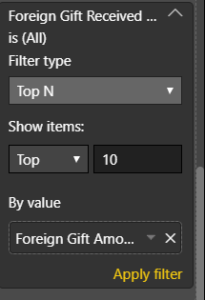
5. Parameters (Top N)?
I used the Top “X” feature to cut the bar chart down to the top 10 countries. However, I still don’t know whether I can use parameters in Power BI to change the numbers the same way I do in Tableau. I found Parameters in the toolbar. However, in the few hours available, this is what I managed to learn!
6. (one more!) Data exploration?
Whenever I add a data source in Tableau, I immediately start exploring the dataset. I create quite a few sheets with exploratory tables that answer some basic questions. I count the records, look at the values, at outliers, etc. In general, I need to take a closer look at how the dataset is structured.
Today, I did all this in Excel. I found it really hard to play with the data on Power BI. Again, it’s probably not what it’s been created for.
Final thoughts: Power BI is too limiting for me
All in all, I loved the challenge. I even finished my dashboard two hours before the deadline!
I’m also quite satisfied with the result.
I still have to find the answer to an error that appears and I don’t want to see Afghanistan appear on the left when no values are selected, just because it’s the first in the list in alphabetical order.
I would definitely suggest it to people I know who are working in small organizations and who don’t have a data analytics team dedicated to managing a variety of datasets and working on some complex analytical tasks.
Thanks, Andy for challenging us with Power BI today!
Here’s the link to my dashboard.
********
Credits: Photo by JESHOOTS.COM on Unsplash