


In my previous post on Power BI Data Models, I explained how a well-structured data model separates facts and dimensions. Today, I want to highlight a practical implication of this structure that can significantly impact your analysis.
When analysing data in Power BI, you might encounter a situation where important categories seem to "disappear" from your visualisations. This isn't because the data is missing entirely - it's because of how your data model works and which tables you're using in your visuals.
The Invisible Products Phenomenon
Let's look at an example from the sample retail data model, that we already encountered in the last post.
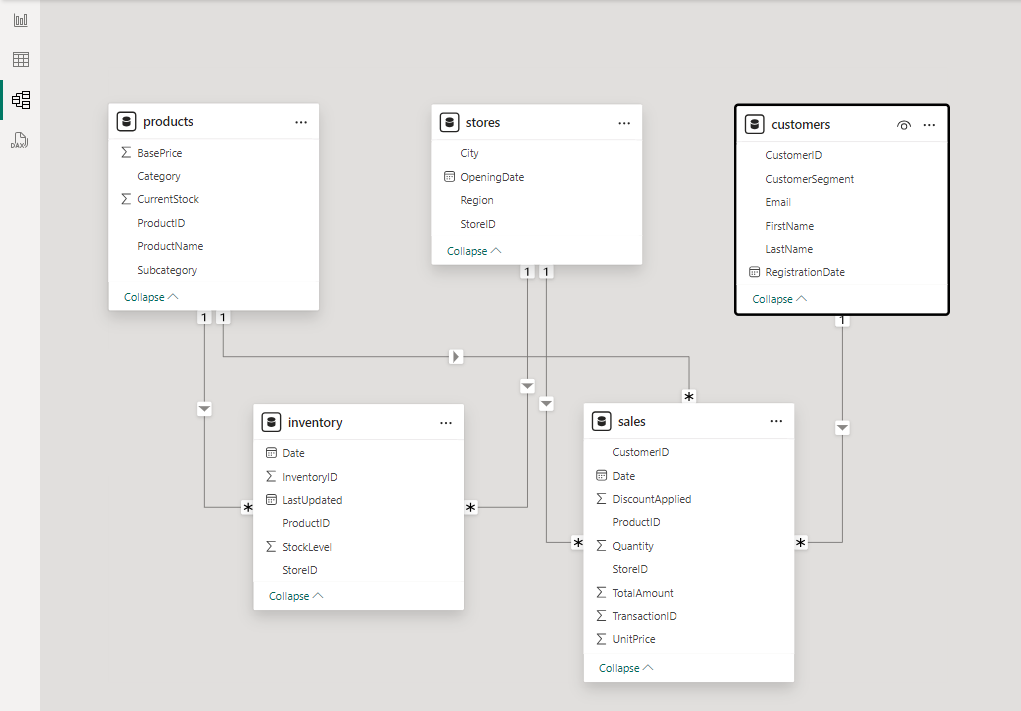
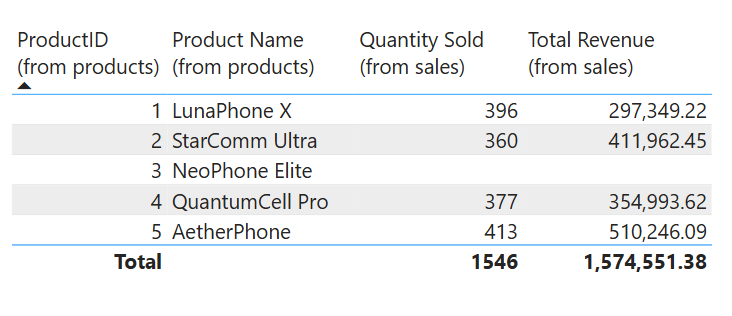
Let's look at an example from our sample retail data model. When creating a table visualisation showing phone sales data with ProductID and metrics from the sales table, ProductName from the products table, you might notice something peculiar:
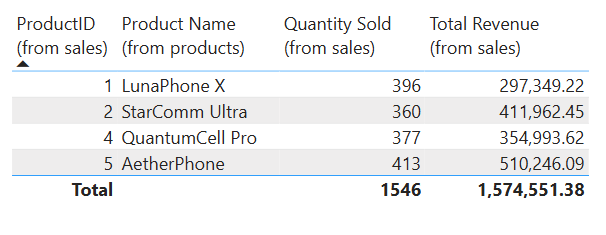
At first glance, you might think all products should appear since we're using the Product Name field from the products table (which contains all products). However, something's missing. Here's what our complete products table actually contains:
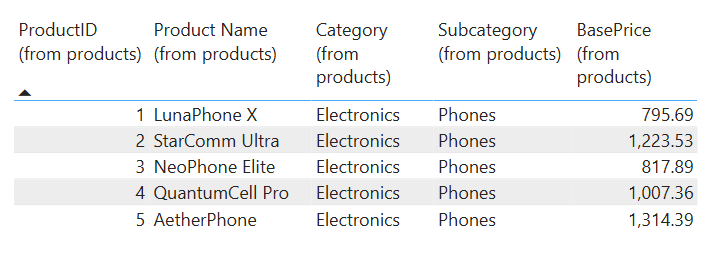
Notice the discrepancy? Our products table contains 5 phone models, but only 4 appear in our sales summary. The NeoPhone Elite (ProductID 3) is completely invisible in our analysis because it hasn't recorded any sales.
Making the Invisible Visible
This behaviour is directly tied to how the data model works in Power BI:
- When you use fields from the sales table (like
ProductID (from sales)), you're essentially filtering your visualisation to show only products that appear in that table - Even though you've included
Product Namefrom the products table, the relationship between tables means that only matching records appear - Products with no corresponding entries in the sales table simply vanish from your analysis
This isn't a bug—it's how relational data models function by default. However, it can lead to incomplete analysis if you're not aware of it.
Solution...
Fortunately, Power BI includes a straightforward fix for this common issue:
- First, make sure you have at least one field from your products dimension table in your visualisation as the very first column field (for this example we just switched our ProductID from the sales table for ProductID from the products table)
- Right-click on any unaggregated field in the visualization pane (such as ProductID)
- Select "Show Items with No Data" from the context menu
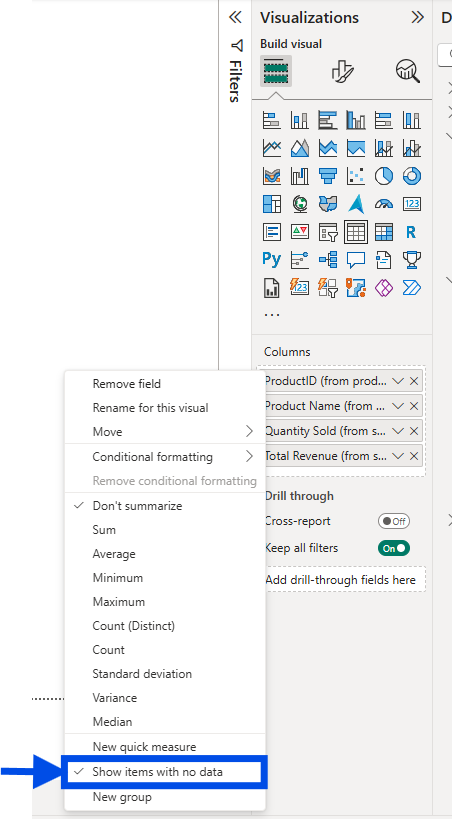
This tells Power BI to display all category values from your dimension table, even when they have no corresponding entries in your fact table:
Data Model Awareness in Your Analysis
This example illustrates a broader point about working with Power BI: understanding your data model structure is essential for accurate analysis. Being aware of how relationships work between tables helps you:
- Recognise when categories might be missing from your analysis
- Know when and how to apply solutions like "Show items with no data"
- Make intentional choices about which tables to pull fields from
- Build visualisations that tell the complete story
Sometimes what's missing from your visualisation is just as important as what's visible. Being aware of your data model's behaviour ensures you never miss critical insights hiding in the gaps.