


If you want to create a calendar-style chart, then this guide is for you!
Step 1: Set up the layout
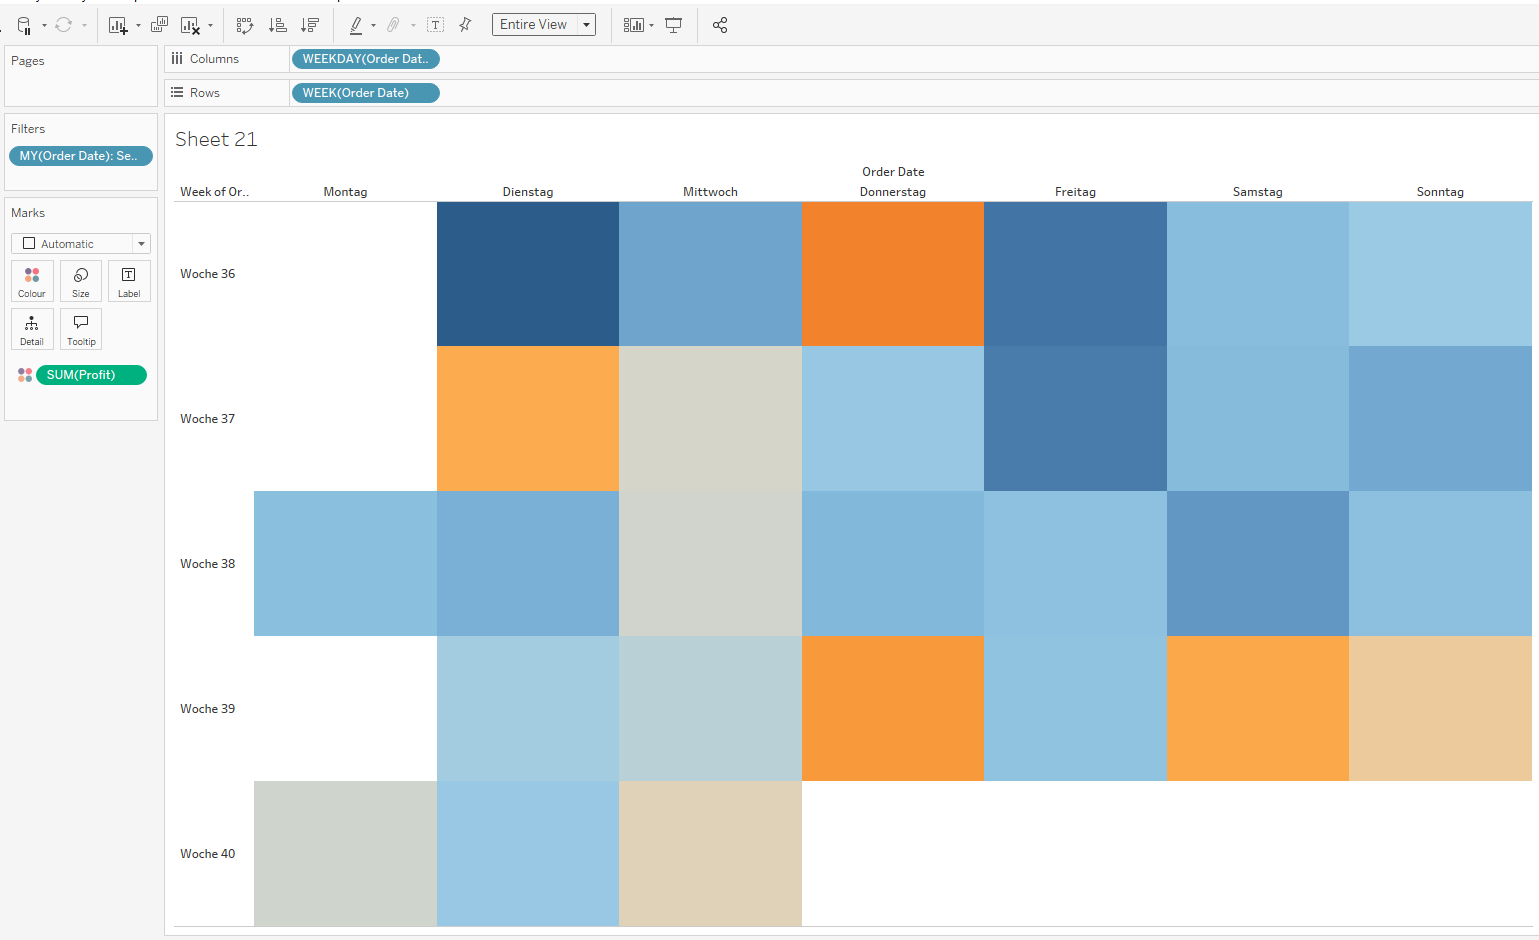
- Drag your "Order Date" (or relevant date field) to Rows and Columns.
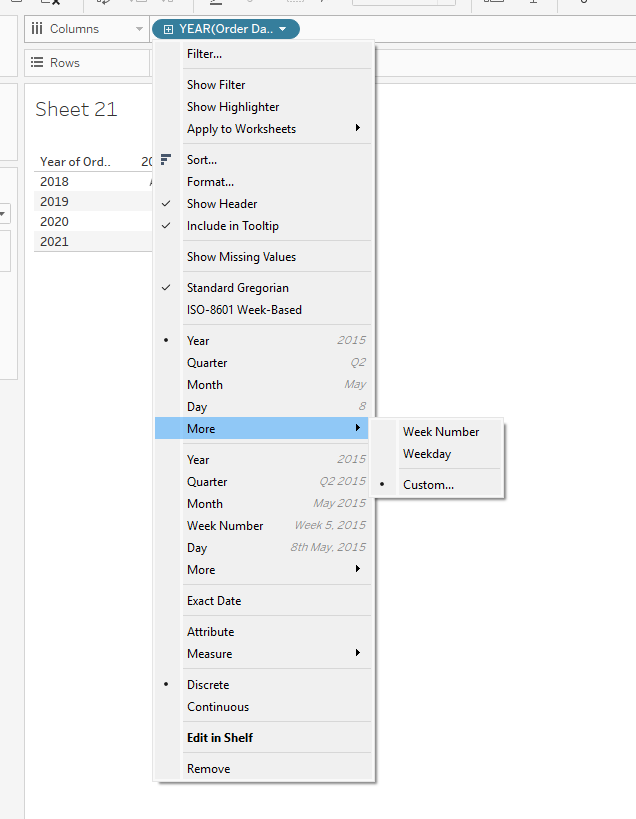
- Change the field on Columns to Weekday.
- Change the field on Rows to Week Number.
Step 2: Filter by Month and Year
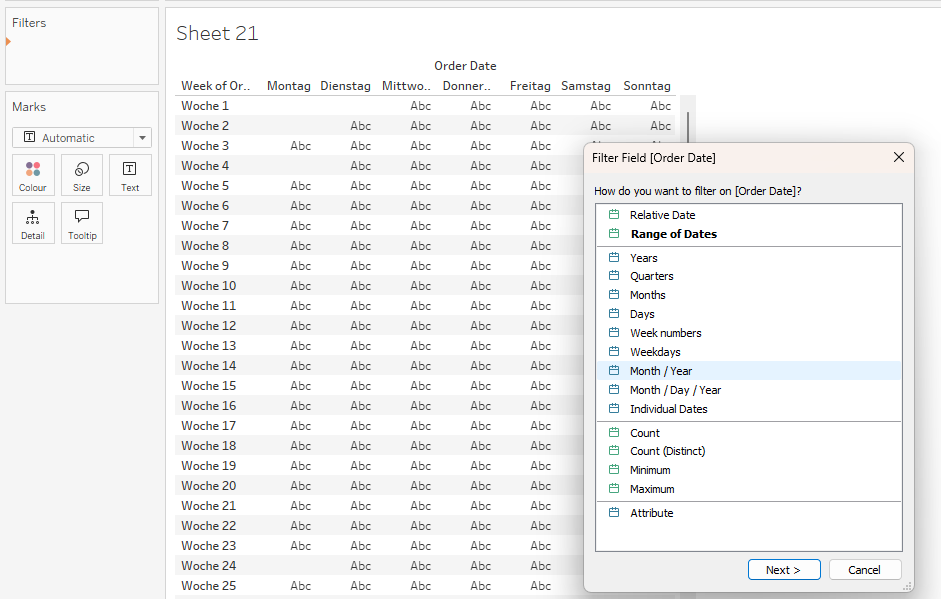
- Drag your date field to the Filters pane.
- Choose Month/Year, and select the specific month you want.
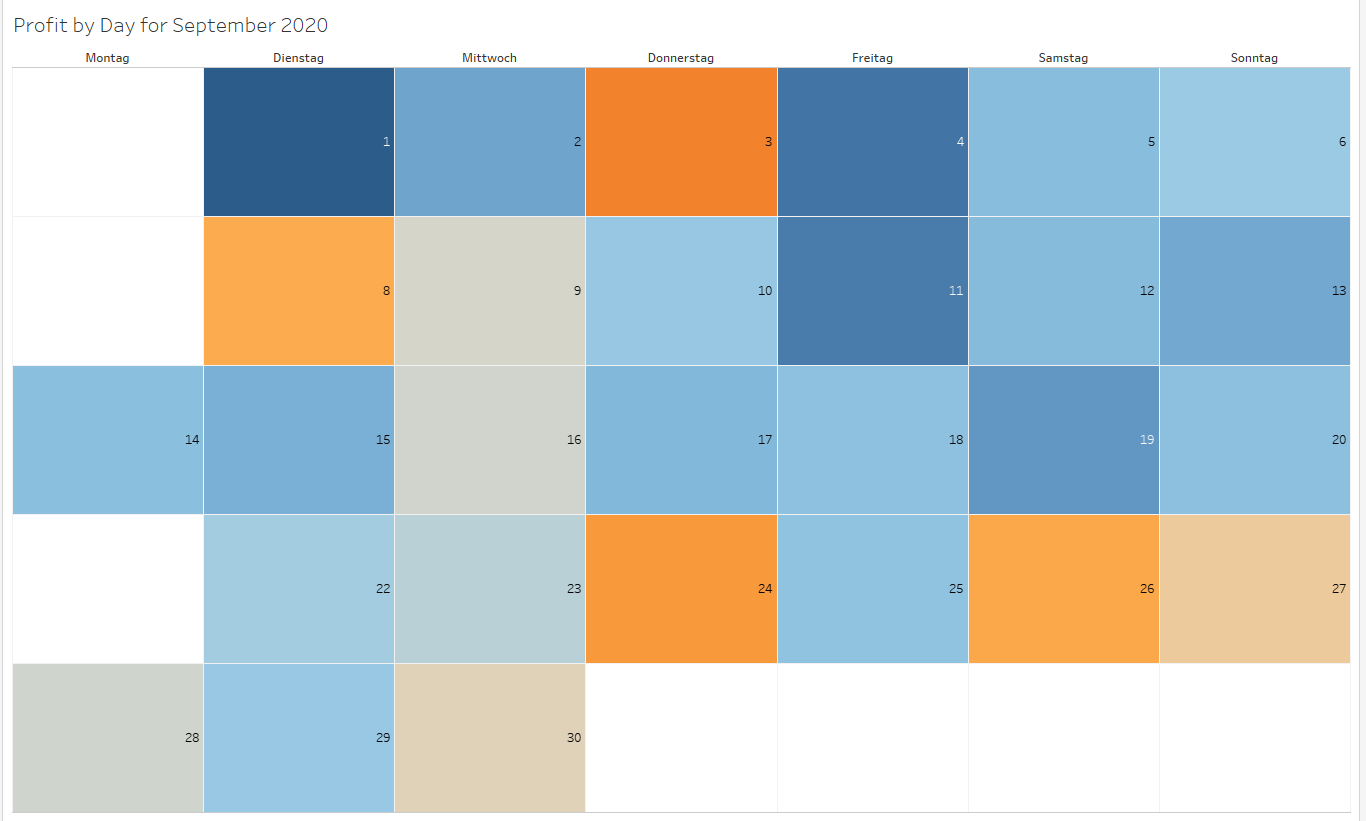
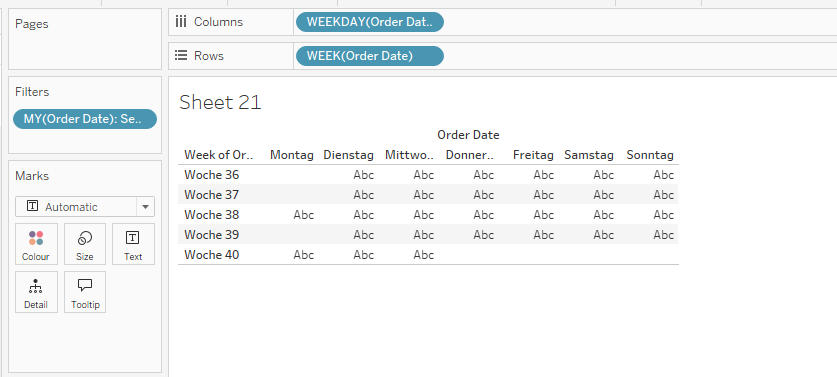
For example, I chose September 2020.
Now your view should start looking like this.
Step 3: Add color by measure
- Drag "Profit" to Color to show performance by day.
- Change the view from Standard to Entire View so the calendar fits nicely on screen.
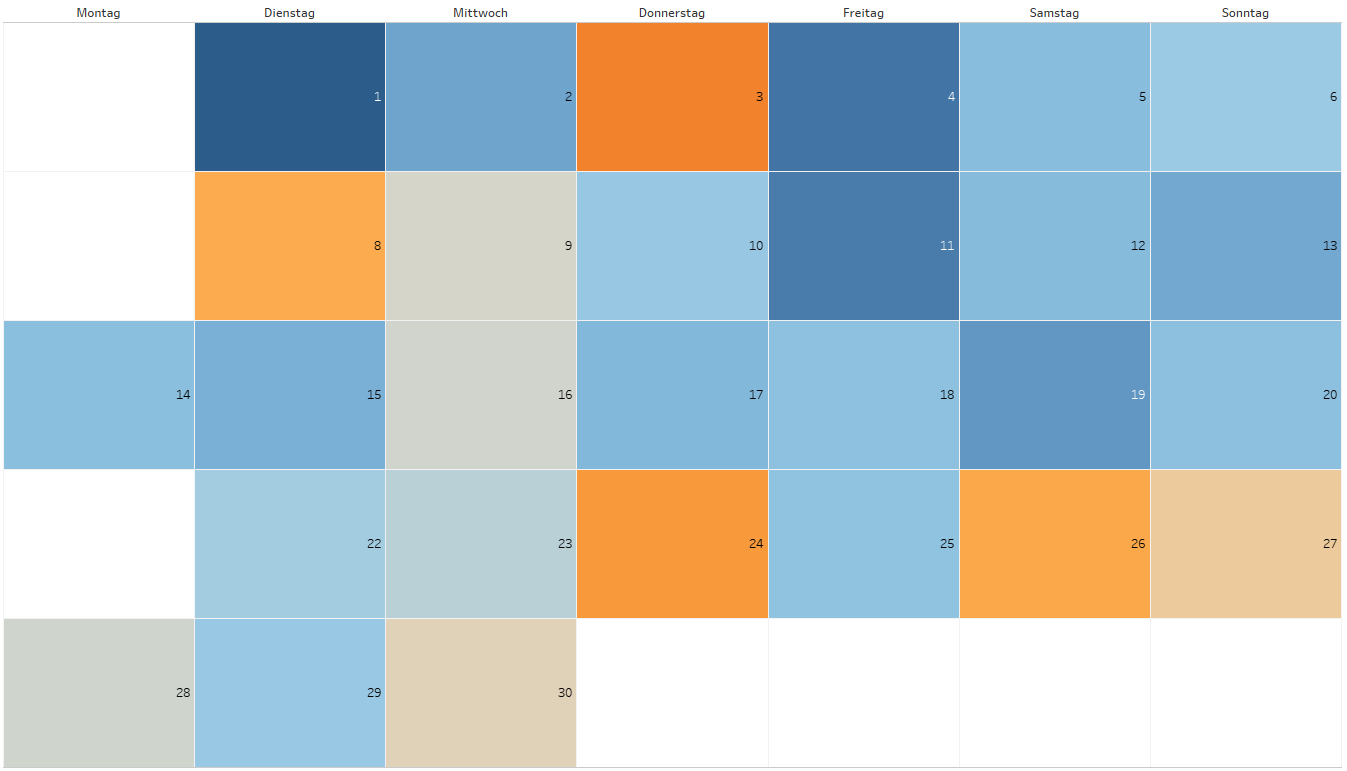
Step 4: Add Day Labels
- Drag "Order Date" again to Label on the Marks card.
- Change its display from Year to Day.
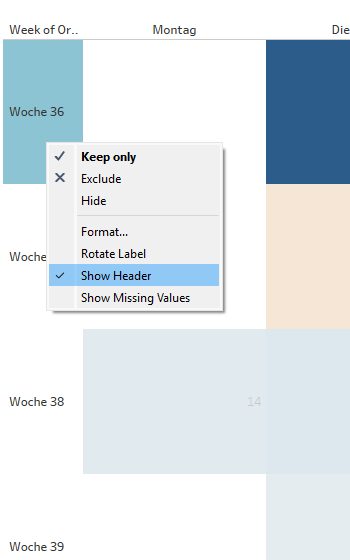
- Optionally, right-click and hide headers to clean up the layout.
Your calendar chart is now complete!
I hope you enjoyed the process — have fun building visualizations in Tableau!