


If you are hearing about sketching for the first time, then you need to read this blogpost.
Last week was the first time I heard about sketching and how you can use it and now I want to share it with you.
You can use Excalidraw. It is a virtual collaborative whiteboard tool that lets you easily sketch diagrams that have a hand-drawn feel to them.
For what can you use Excalidrow?
🧠 Brainstorming Ideas
Jot down thoughts quickly using shapes, arrows, and text. It’s great for mapping out ideas visually.
📊 Flowcharts & Diagrams
Create process flows, user journeys, decision trees, system architecture, etc.
📎 Collaborative Whiteboarding
Work together in real-time with teammates — great for remote work sessions, planning meetings, retrospectives.
🎨 Visual Storytelling
Sketch out scenes, timelines, or comic-like frames to tell a story or explain a process.
When you open it for the first time, you see in the toppanel. You can use it for building a new Rectangle, diamond, ellipse, arrow, line, drawing, text — or can you insert images. The toolbar of which will be enough for the first familiarization
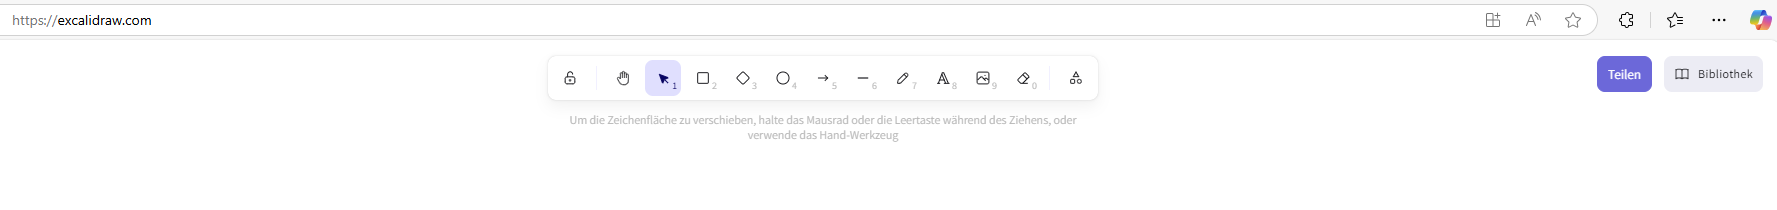
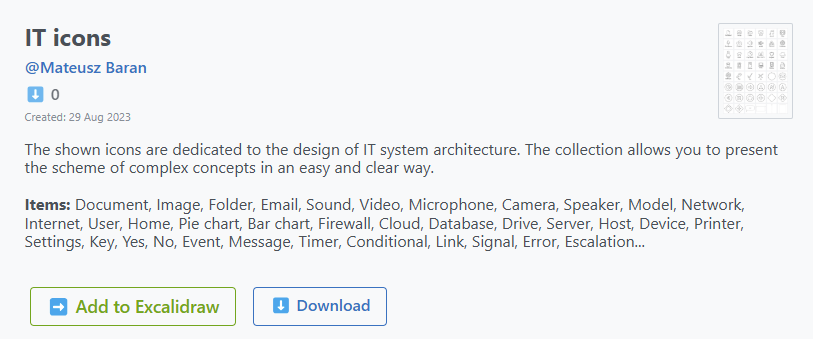
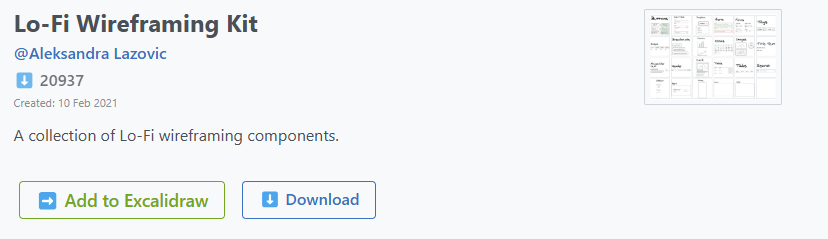
You can also use libraries. On my screenshot above you can see it like ‘bibliotek’ on the top right. In the library you can find new sketching for every topic.
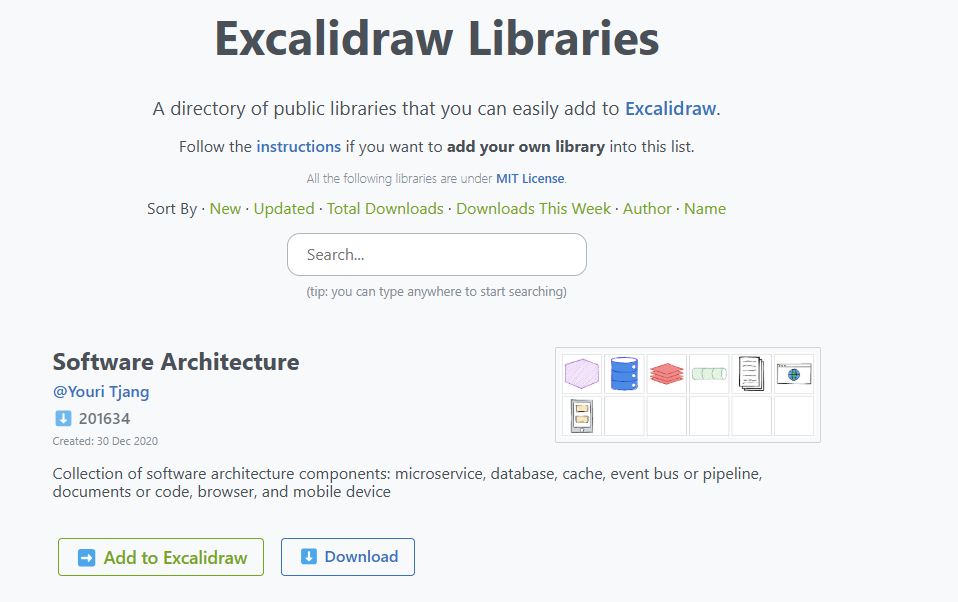
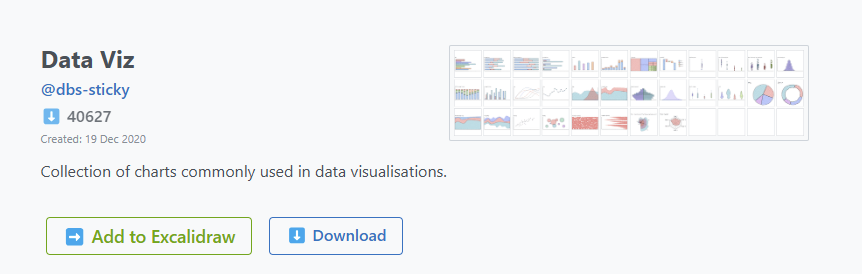
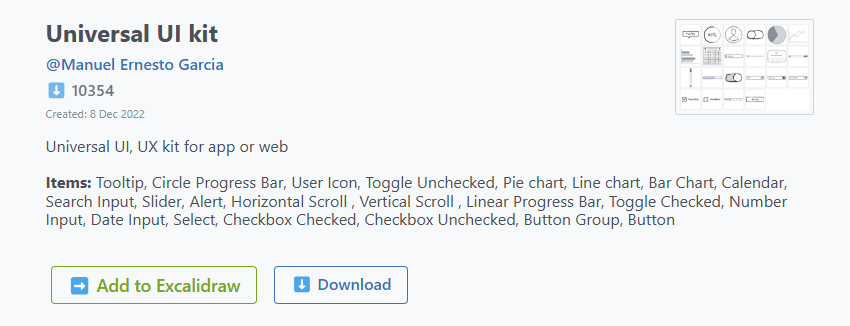
My top libraries to use:
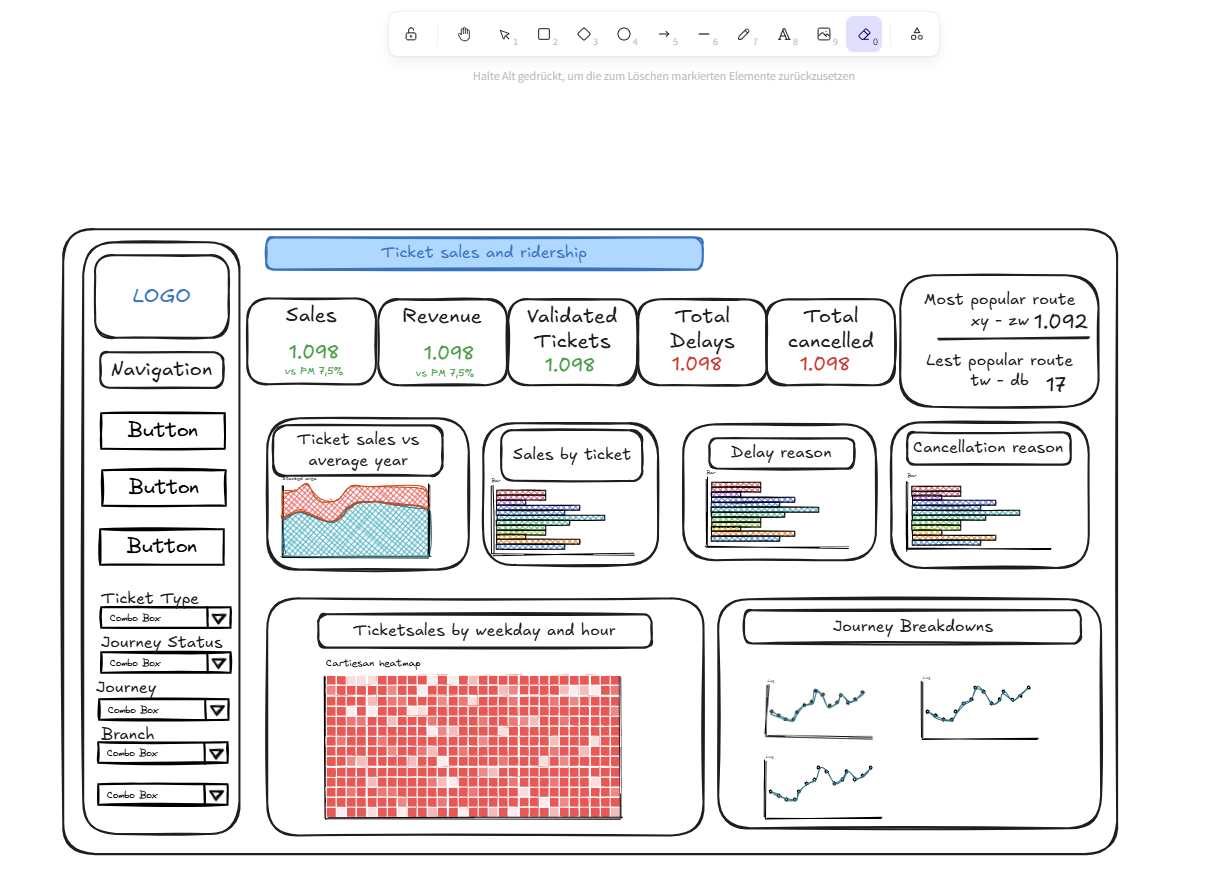
You can use it for everything: create your plan for the data cleaning steps in Tableau Prep, build data structure or what you need… Here is an example of a sketch I made:
If you want to talk about this topic you can find me on Linkedin!
Thank you for your interest 😄