


Today we had to work with data of Elon Musk's tweets and one interesting chart that came to my mind was doing a word cloud of his most tweeted words. You need to have a column containing these tweets; this was also in the dataset.
First you need to do some little cleaning which I did in alteryx. You need to split these tweets and put every single word on a separate row. Then using a data cleansing tool you can get rid of spaces, punctuation and make the words lower case. For a more meaningful visualization, it is important to get rid of most commonly used words in english, eg. a, an, the, it, is, are, you, me, etc. You can create an input file an write each of these words on a separate row. Then do a join of these two files and take the join output that didn't match the common english words. Save this output.
In tableau, you then connect to this file. Drag and drop the column containing the tweets unto Text on the marks card. Drag this field again from the data pane and drop it this time onto the Size card. Configure it as below
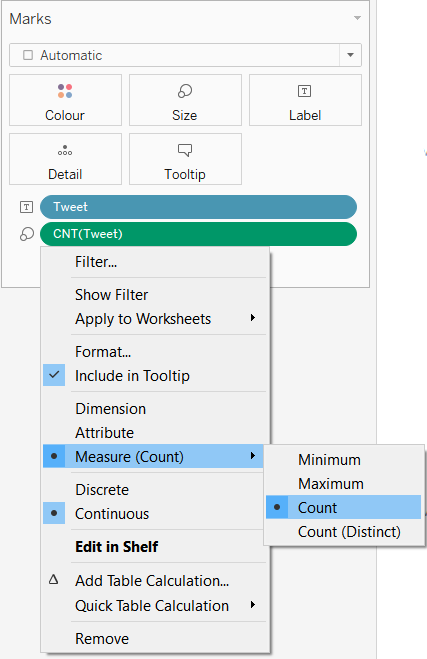
It will automatically change your marks type to a square. Change it back to Text.

You can put the CNT(Tweet) on filter and filter to tweets that have more than a certain CNT. Now your words should be sized according to the number of times they appear in the tweet column and should look like this.