


Blending describes one of the processes of combining 2 tables from different data-sources. Here’s how it looks like in Tableau…
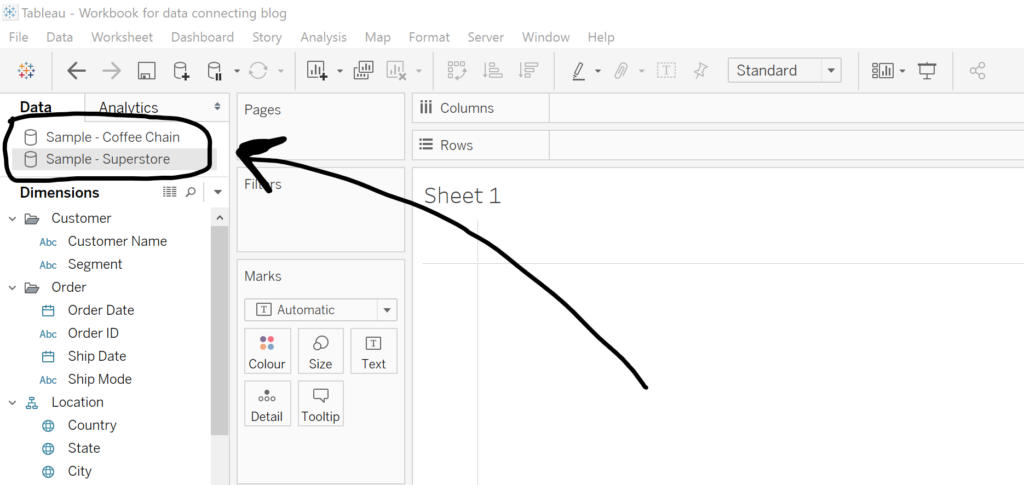
Suppose we’ve connected to both Sample Superstore and Sample Coffee Chain:
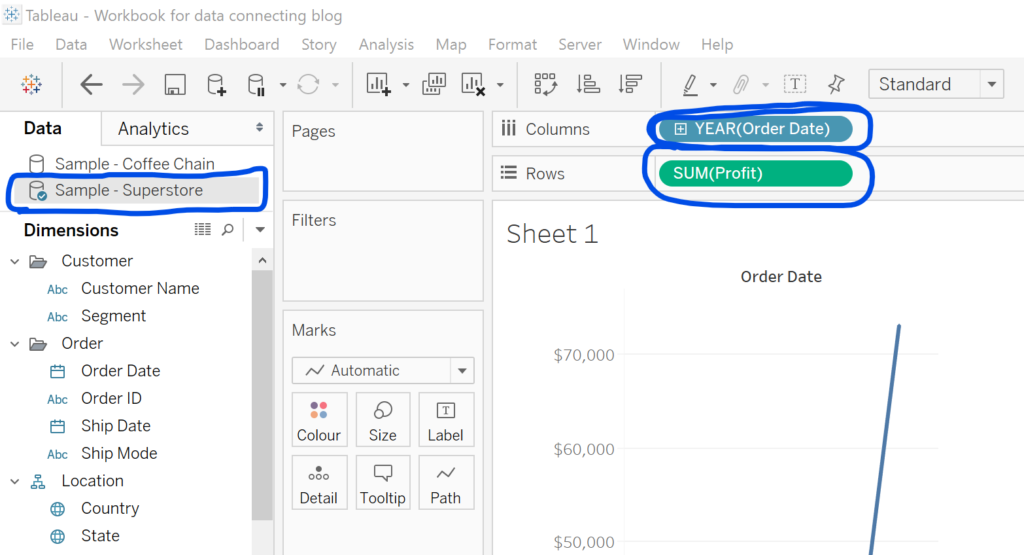
As soon as we put fields from Sample Superstore in the view, we get a Blue tick mark next to our Sample Superstore data connection. This is Tableau telling us that this is our Primary data source:
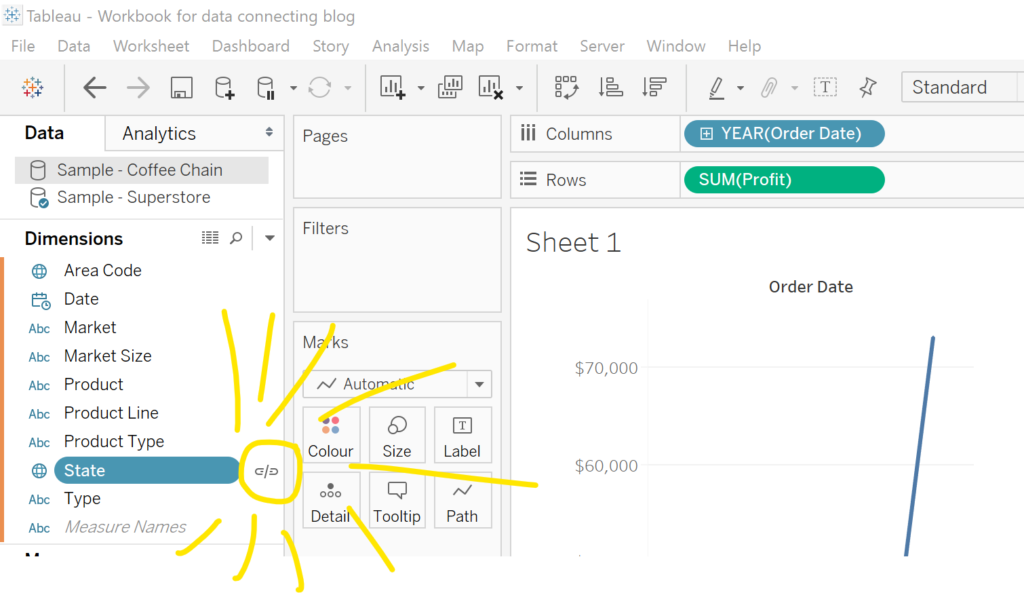
If we then click on the Sample Coffee Chain data-source, we see the State field has a broken link icon next to it. This indicates that Tableau has recognized that there are identical field names and data types in both data-sources, and that Tableau can blend these 2 data-sources together, joining on the State field:
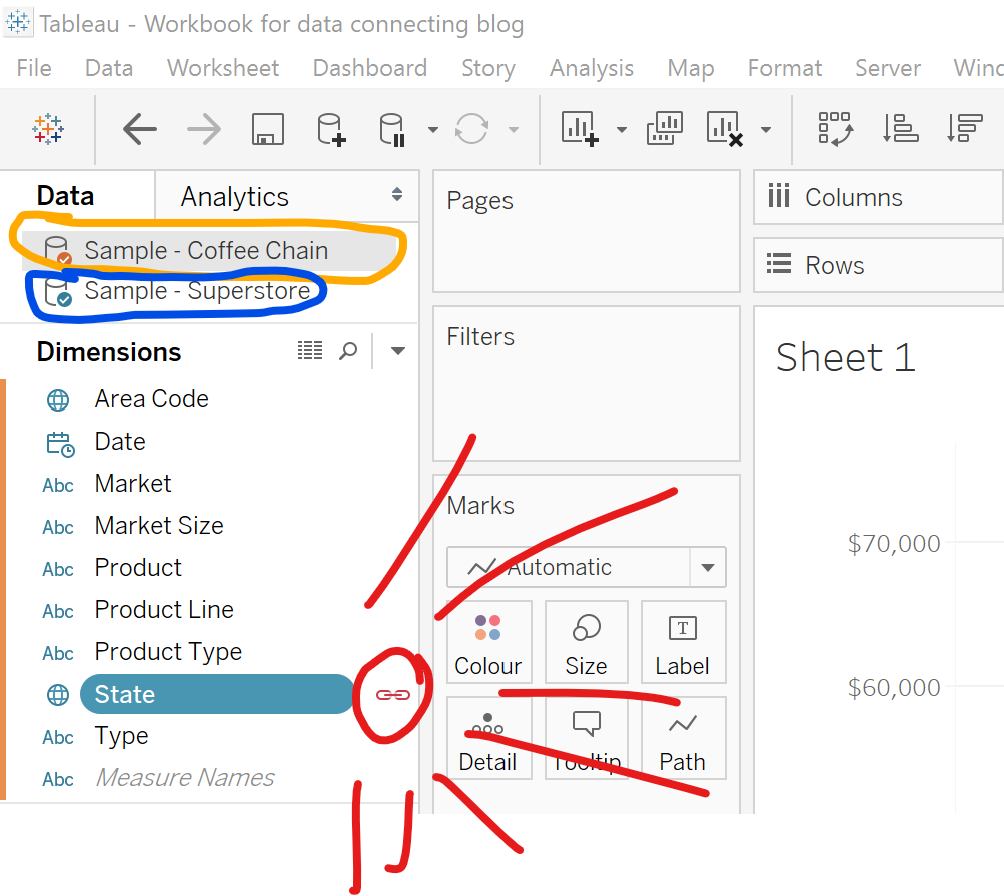
And if we click the link that’s exactly what happens. The link turns red to signify the blend has been made, and the Sample Coffee Chain data connection has an orange tick mark next to it to indicate that it is our Secondary data-source:
The significance of the Primary and Secondary data-sources comes from the join type. The join is ALWAYS a left-inner join, where the left table is the Primary data-source.
The logic of these joins is explained in my previous blog on joins: /matthew-armstrong/connecting-data-joins/
From here, you can treat the data in this sheet as a single table made from the join of the 2 data-sources, meaning you can create calculated fields and populate the view with fields from either source.
You can also choose to join the data on more than one field. In this case, the matching rows must satisfy ALL joining conditions to be contained in the generated table.
However, there are some considerable limitations to this technique. Firstly, when combining the sources in a calculated filed, the Secondary data source MUST be aggregated:
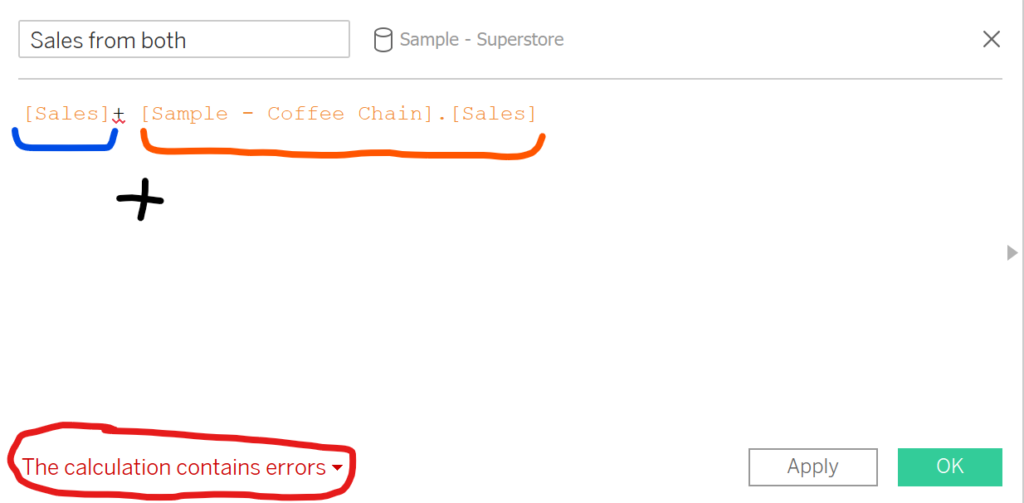
since Sales (Orange) is automatically aggregated.
If we try to add Sales not aggregated from Sample Coffee Chain, we get an error. This removes a lot of the functionality from Tableau when we’re exploring the data. Secondly, we’re only able to perform a left-inner join, which might not always be what we want.
That said, a HUGE positive of blending is the fact that the connection is only applied to one sheet, meaning you can flexibly blend data-sources and revert back to your original data on a new sheet.
One final tip: Be VERY careful about the order in which you populate your sheet! Blending ONLY performs LEFT INNER joins, and it treats the primary (/blue) data-source (source which populates the view first) as the left table, so it’s critical you are deliberate about the order of the process.
Hopefully, this has given you a better understanding of the Blending process in Tableau, its benefits, limitations, and intricacies.