


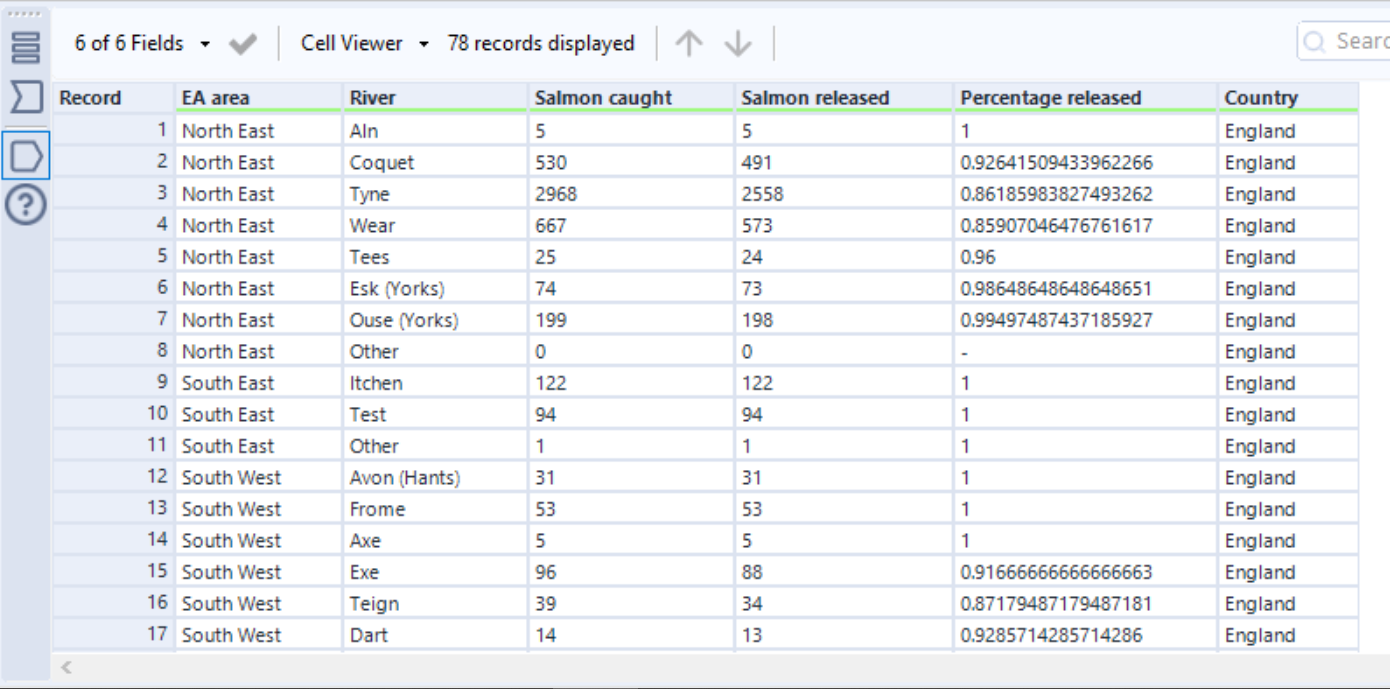
Today we were challenged to build a dashboard using UK fisheries data (available here). Specifically this data relates to the number of reported catches of various types of fish around the England and Wales. I chose to focus on pole-caught salmon from English and Welsh rivers, and decided to combine this with spatial river data to map the results.
After some cleaning in Alteryx, the pole-caught salmon data looked like this:
Now I needed to find some spatial files for the rivers, in order to map the number of salmon caught in each. I got these from the OS Open Rivers dataset. After putting the .shp file into Alteryx, I found there was some cleaning to do before I could join the two datasets. For example, what was called the River Tamar in the OS dataset was the Tamar in the fisheries data. Also, the OS dataset contains two name columns, where an alternate is sometimes given when the main name is not used in English.
With the joining complete in Alteryx, I saved the output file as a .tde an opened it up in Tableau, and used it to create this dashboard:
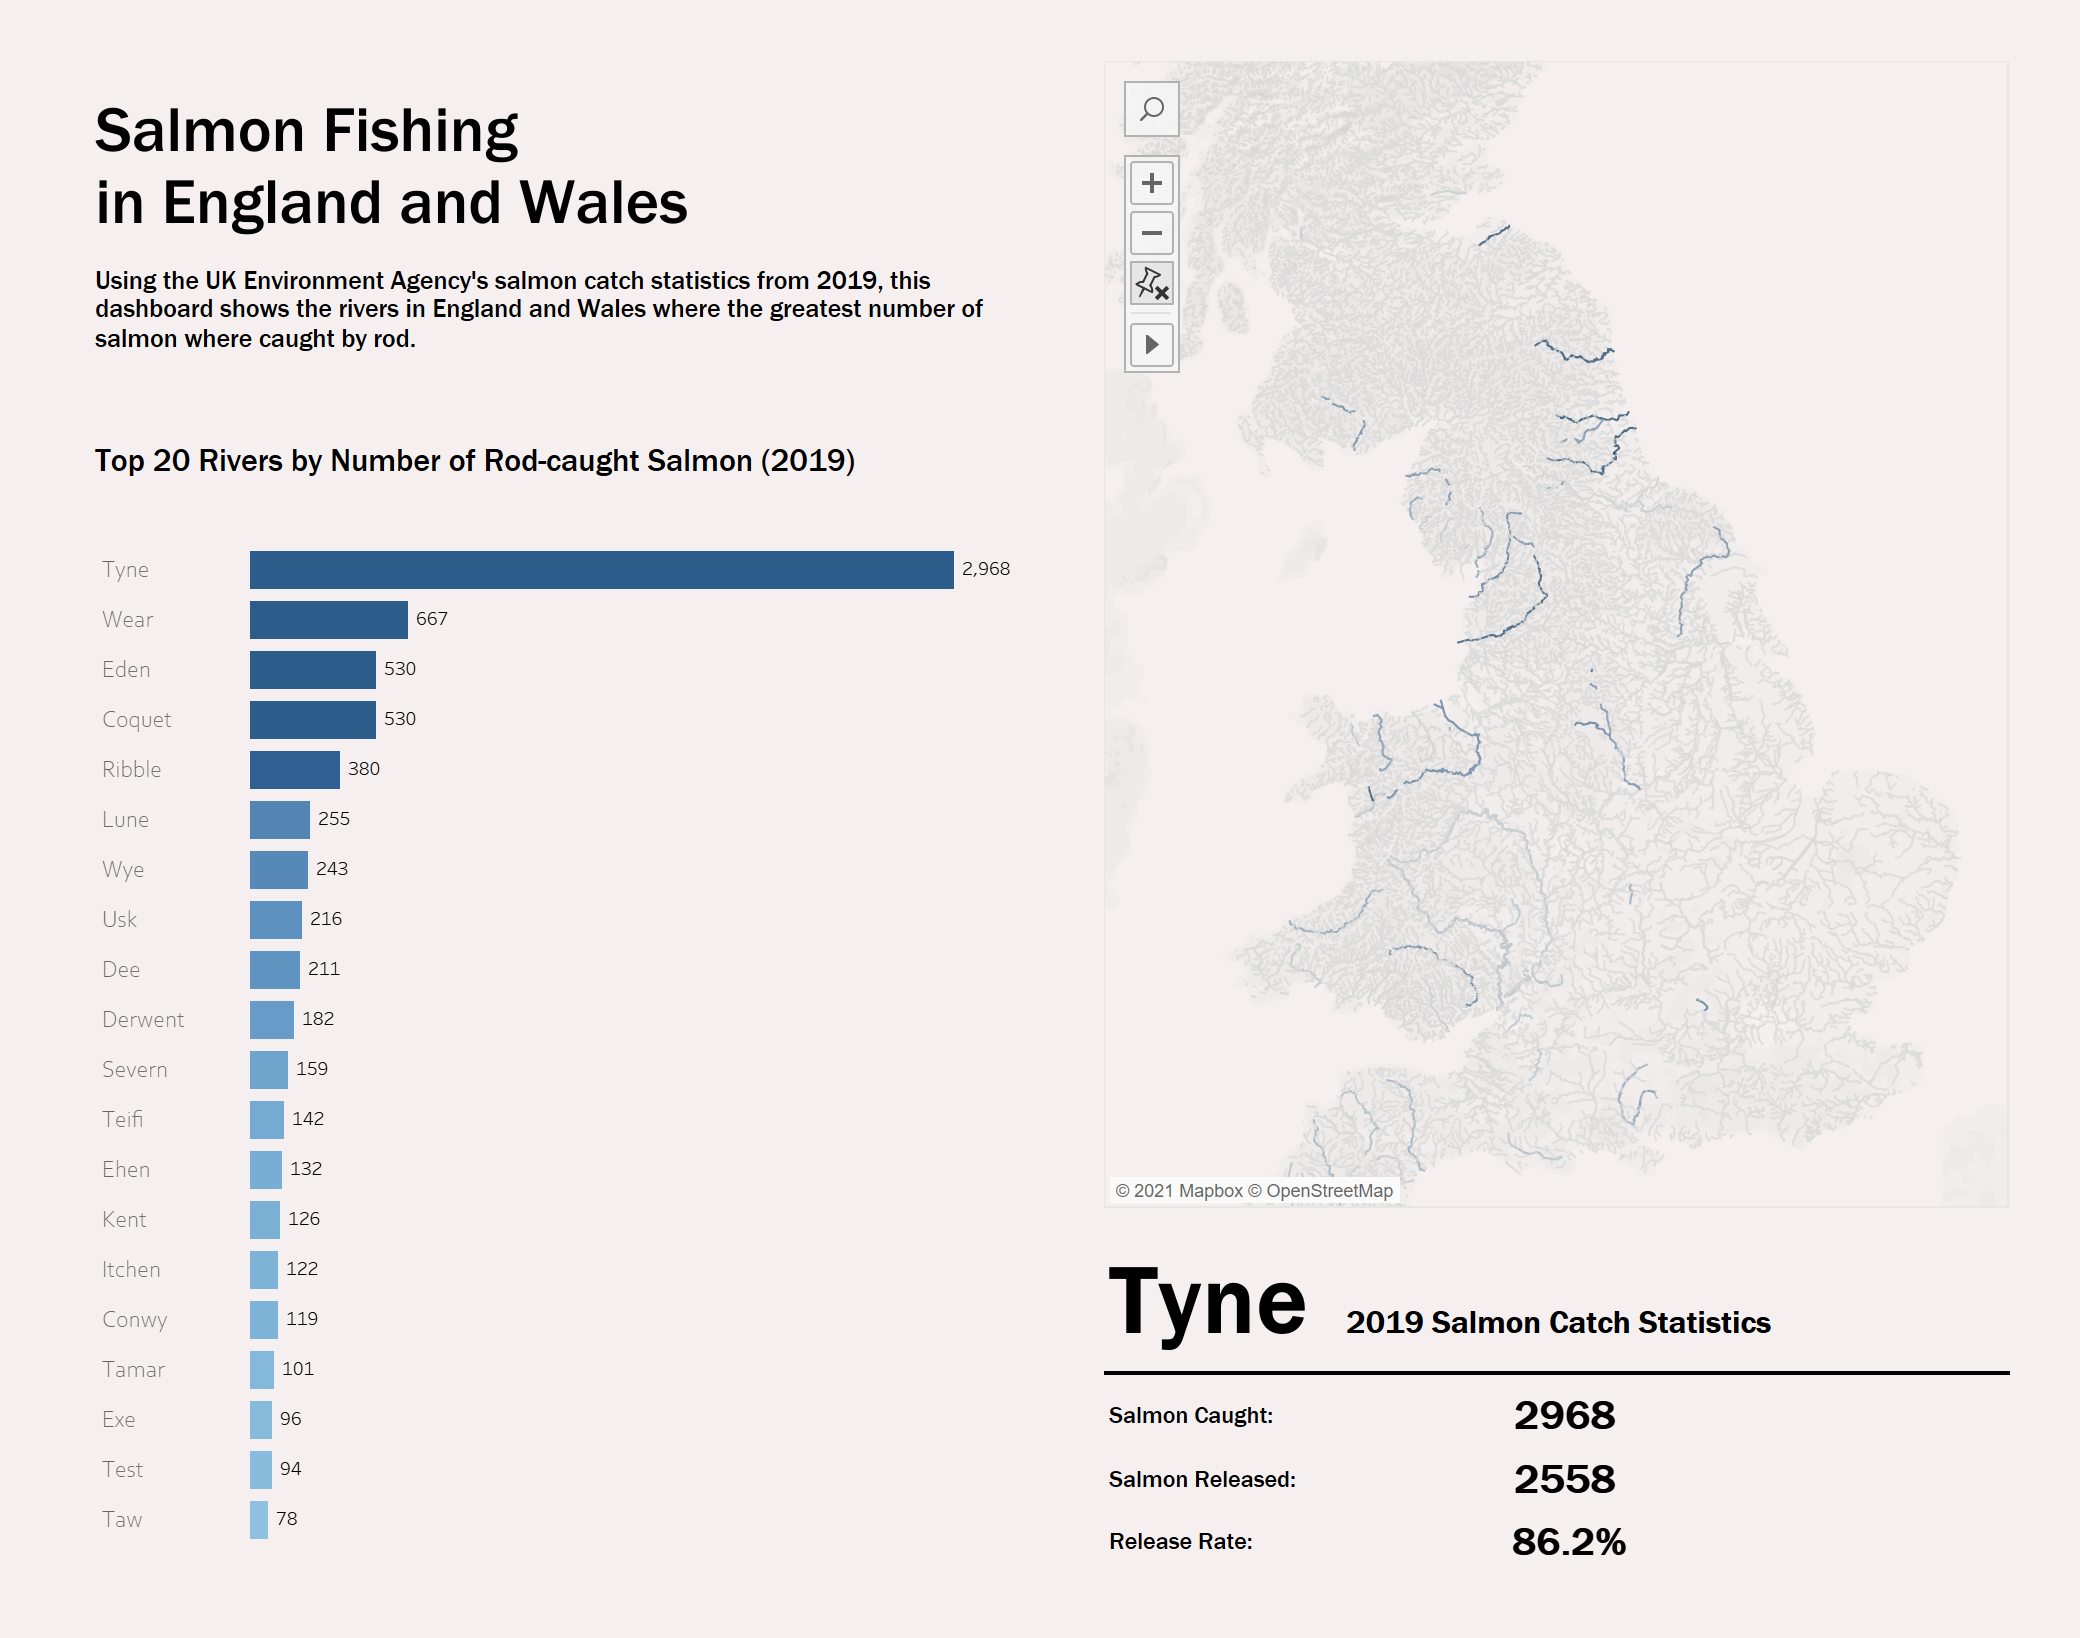
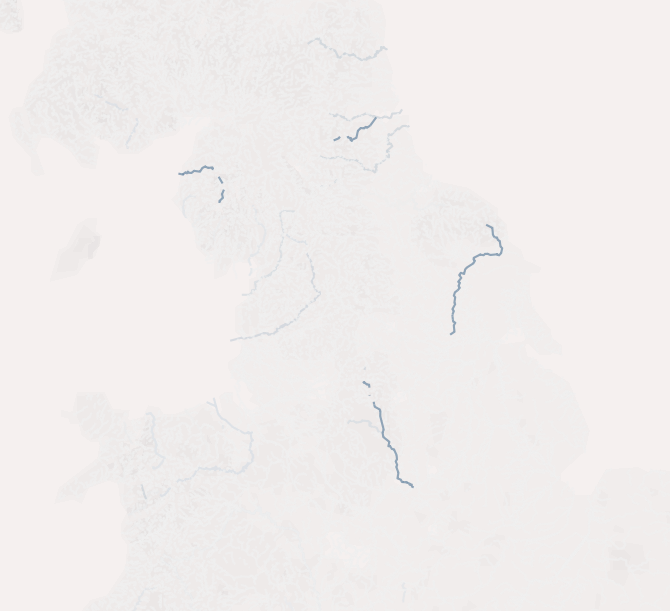
There are still some faults in the dashboard. One of these is thanks to many rivers throughout the UK sharing the same name. For example, I have found four River Derwents on my map. The Derwent referred to in the fisheries data is only that which flows through Cumbria, but currently all four Derwents are highlighted in the dashboard when this Derwent is selected.
The only way around this I can see is to go back into Alteryx and manually split the shape files into their separate rivers. It made we wonder which is the most common name for a river in the UK. The record I've found so far is five River Fromes.