


Day 1 of Dashboard Week - we got a dataset for fishing statistics from 2019 that was split by type of fishing (net and rod) and also species of fish (salmon and trout).
After having a look at the data within the tables, I began by making notes on initial graph ideas as well as thoughts on how to manipulate the data in Alteryx before putting it into Tableau.
I made 2 workflows shown below, one to prepare the rod catching data and one for the net catching data to use in Tableau
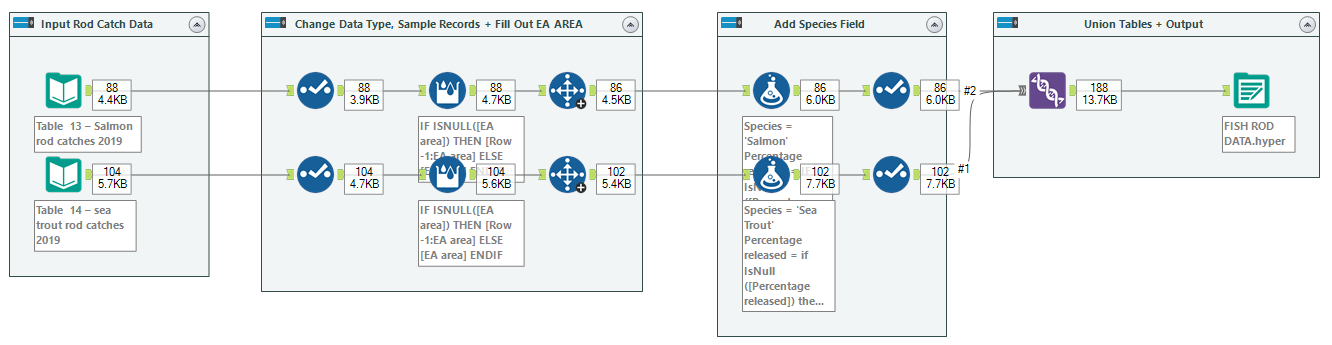
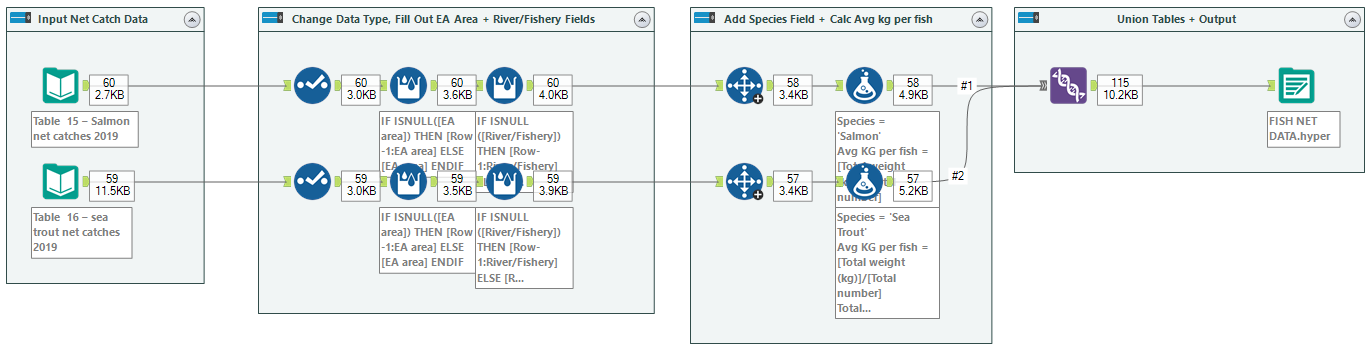
The data wasn't too strenuous to prep and both workflows were made with a very similar approach. I did try to find spatial data to match with the rivers and fisheries however due to time constraints I had to ditch the idea and make something with what I already had.
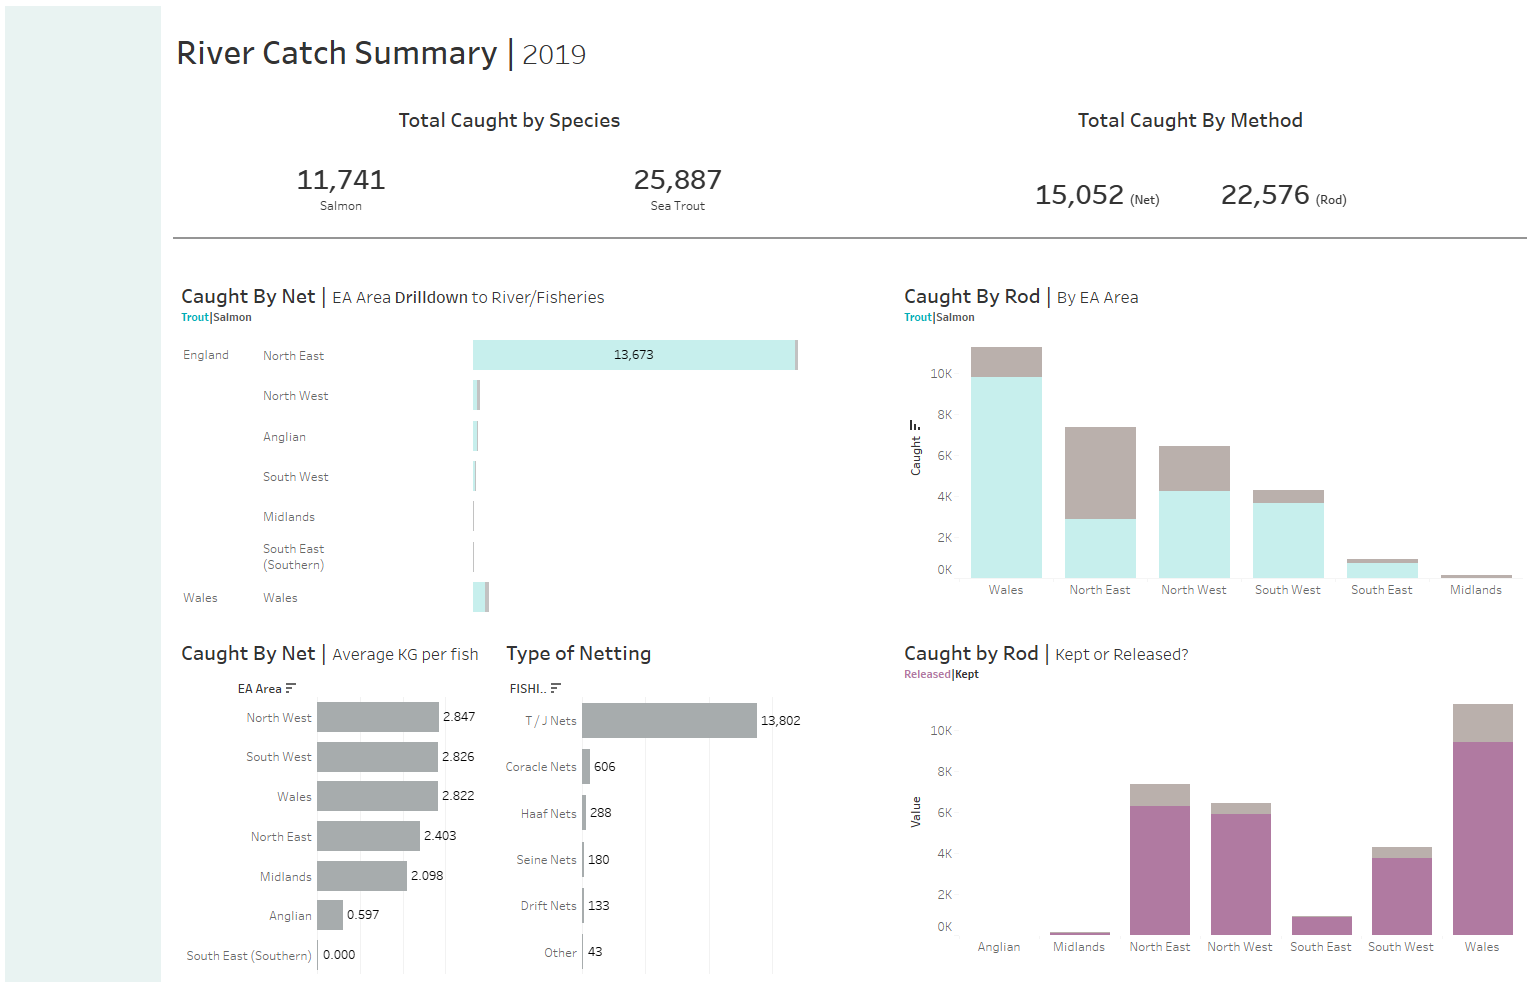
Once I inputted the new datasets into Tableau, I generated several graphs which predominantly broke down the types of fishing and began to build my dashboard which ended up being more of the exploratory type.
I was just able to publish the dashboard onto Tableau Public with a minute to spare so next time I need to work on managing my time a little better and being more decisive as to when to move onto the next task.