


Day 3 of Dashboard week and today we were tasked with creating an APP in Alteryx and connecting the data to a Tableau Dashboard.
Based off of the previous days I really tried to focus the scope down to be manageable… spoiler, it wasn’t!
First off I created a plan trying to give myself plenty of time to create the Alteryx APP and also to create a dashboard in tableau:
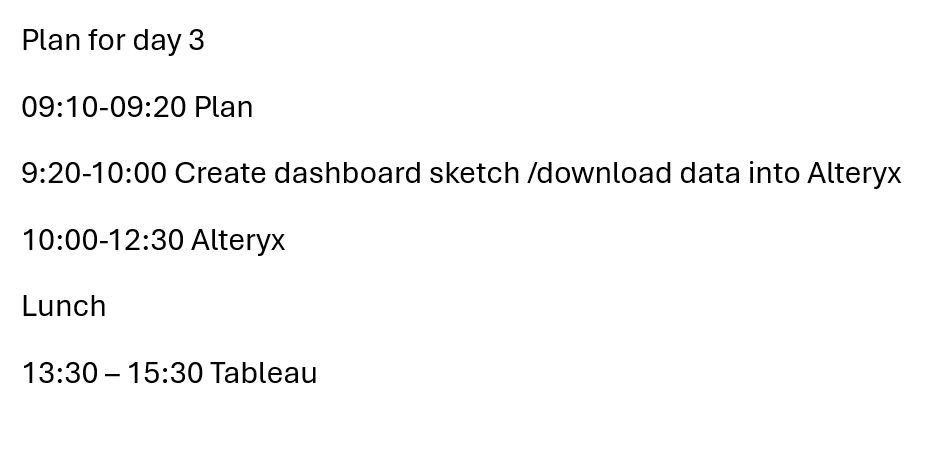
I did manage to keep to this plan pretty well until Lunch where all hell broke loose for 45 mins when it looked like I had deleted my entire Alteryx flow ☹. Thankfully it was recovered!
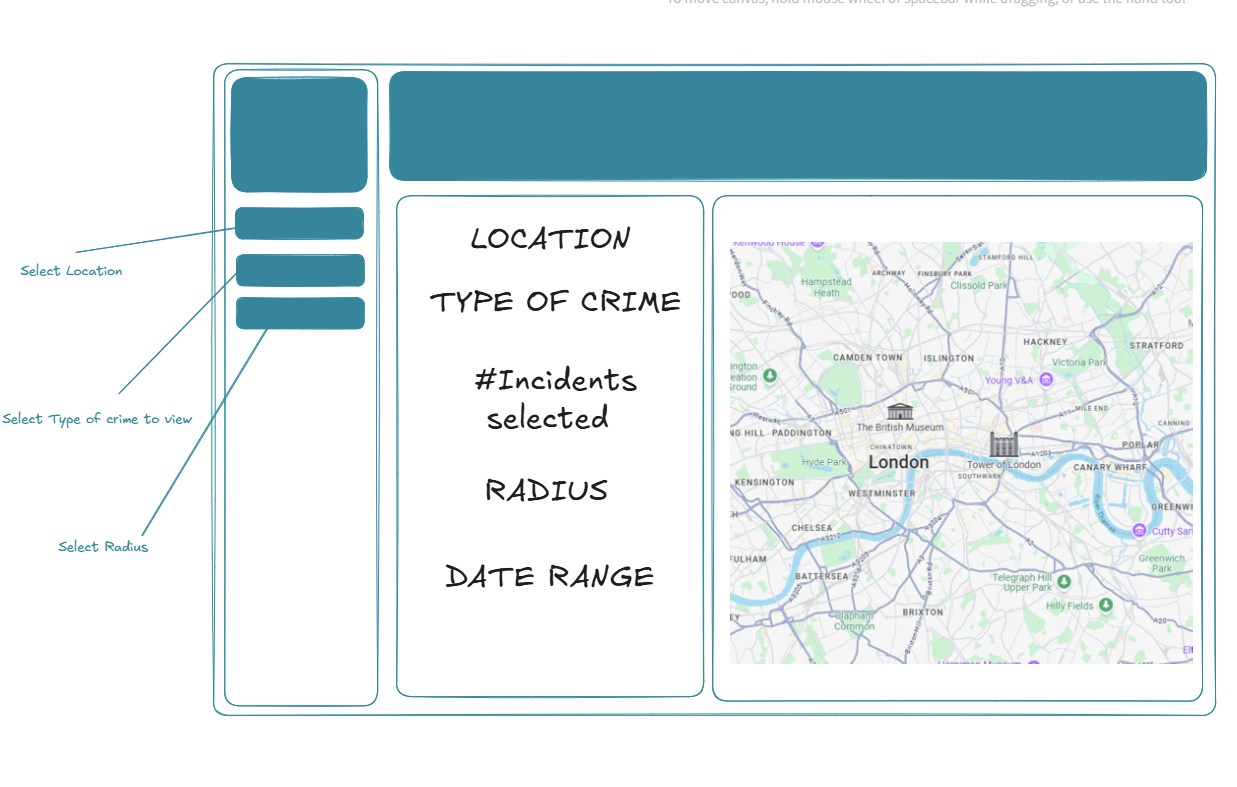
So when sketching my dashboard idea I wanted to keep my dashboard really, really simple. I wanted to focus on creating the app and ensuring it updated the dashboard correctly.
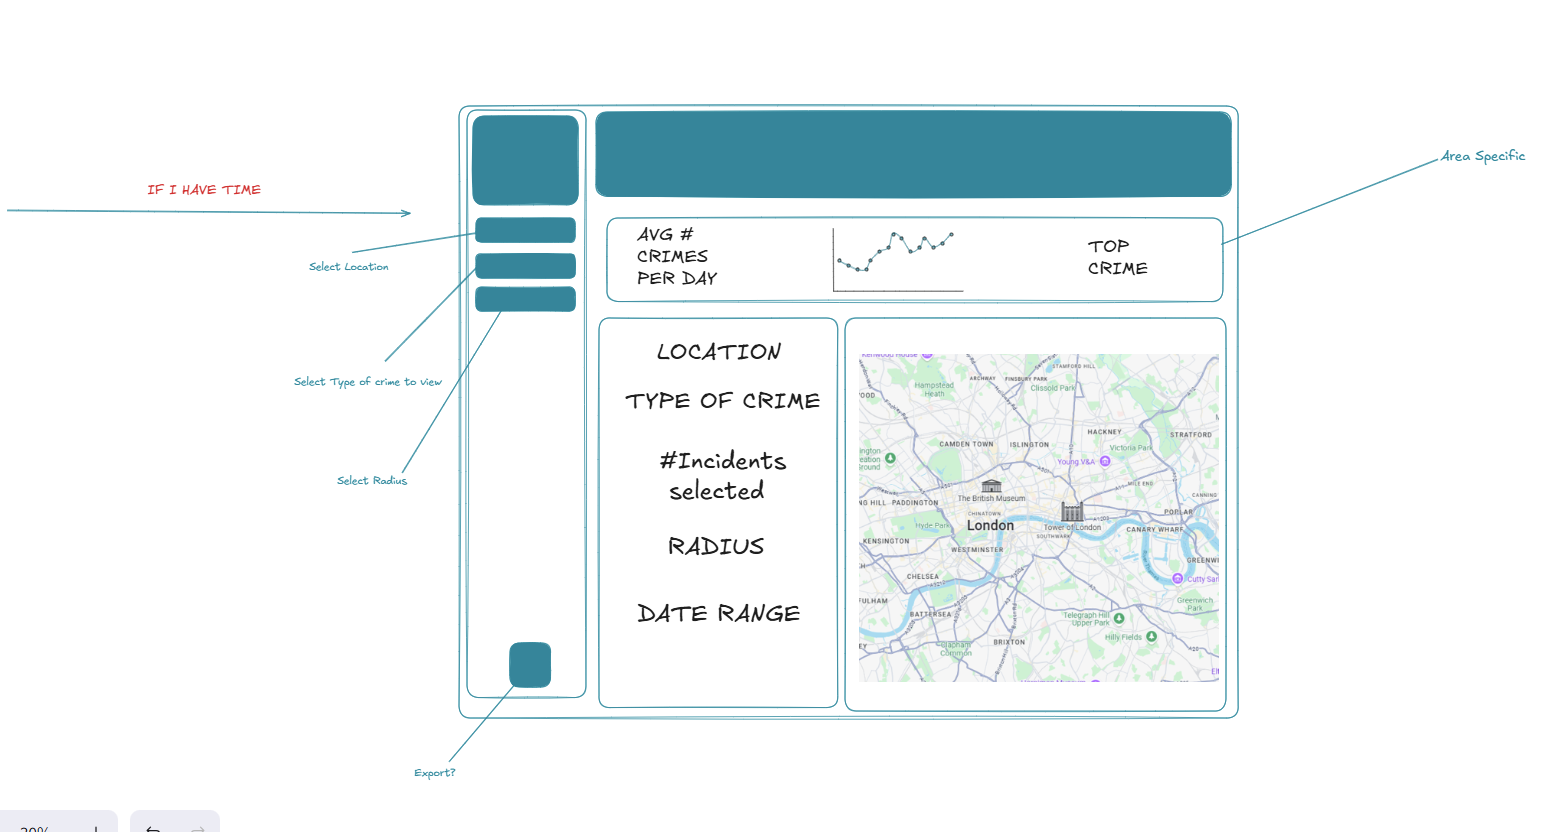
I couldn’t help myself but add another sketch that included some more KPI’s:
After deciding on a sketch I started on my Alteryx flow, here’s the finished flow:

This flow allows the user to select an area, date range, crime type and radius from a location.

As mentioned, I did keep to my plan fairly well, but at lunch it was one challenge after the next, first the deletion scare, then implementing the tableau output tool. The Tableau output tool allowed me to upload my data source to tableau server, which I did successfully do, however the flow took a while to run and doing this for the first time ensured a lot of my tableau build time was eaten into. Furthermore, once I started building the dashboard it became clear to me that creating a map was going to be outside of the scope but I did want to be able to see the data change so I opted for a line chart instead.
Here's the finished dashboard:
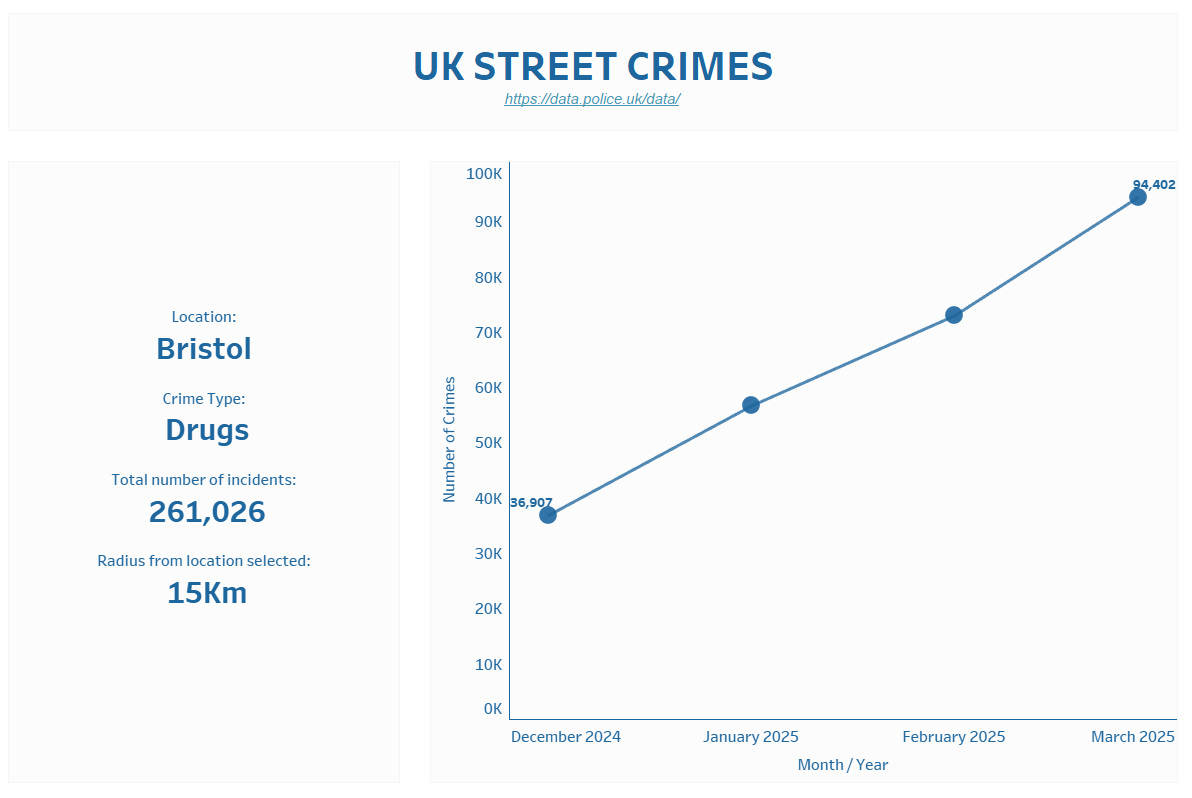
Whilst quite a simple dashboard the APP does work! All you need to do is select your desired output and run refresh:

Once this is added to server no refresh is required!
Future steps would be to create the map and add some more interesting KPIs.