


Before diving into analysis, data needs to be understood, cleaned, and reshaped. One option for reshaping is aggregation.
What is aggregation and why would you need to aggregate data?
Aggregation is the grouping of data to reduce the level of granularity. We may need to aggregate data in order to get specific insights from our data. For example, if we had sales data including sales price, country, region and year we might want to find the sales price per country and year. This means we no longer have the region sales price and reduces the level of granularity.
Lets show an example of how to aggregate data in Tableau Prep. Here we have some data from week 2 2024 preppin’ data showing flight data.
Here’s the final data flow (we will only be focusing on the highlighted section):
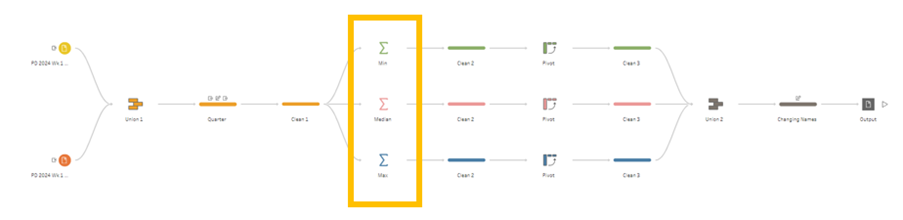
In this highlighted section we want to aggregate data to find the median price of a ticket per Quarter, Flow Card? and Class.
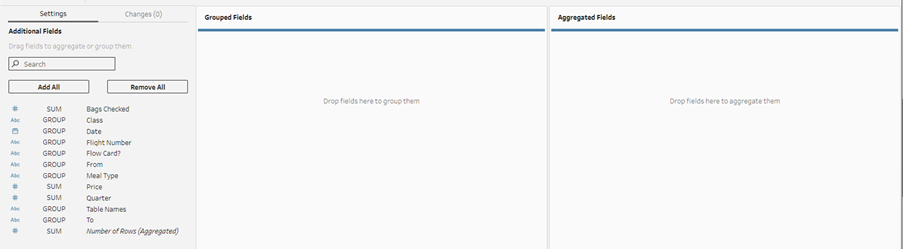
To aggregate data we need to add an ‘aggregate’ data step in the data flow.
After selecting aggregate this pane will appear:
We need to determine which fields are going to be grouped and which are going to be aggregated. Because in this example I want the median price per Quarter, Flow Card and Class I put price in ‘aggregated fields’ and Quarter, Flow Card? and Class in ‘grouped fields’:
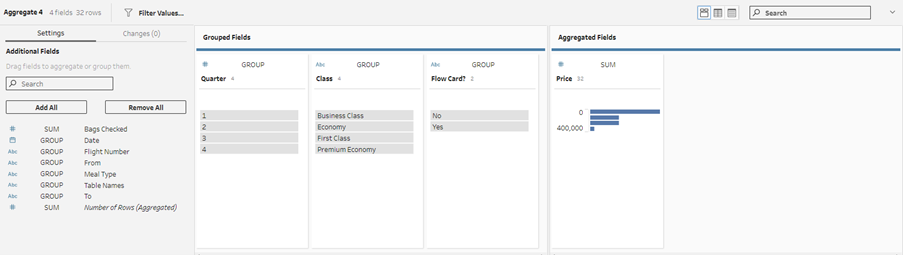
To change the sum of price to median you click on ‘sum’ and select median:
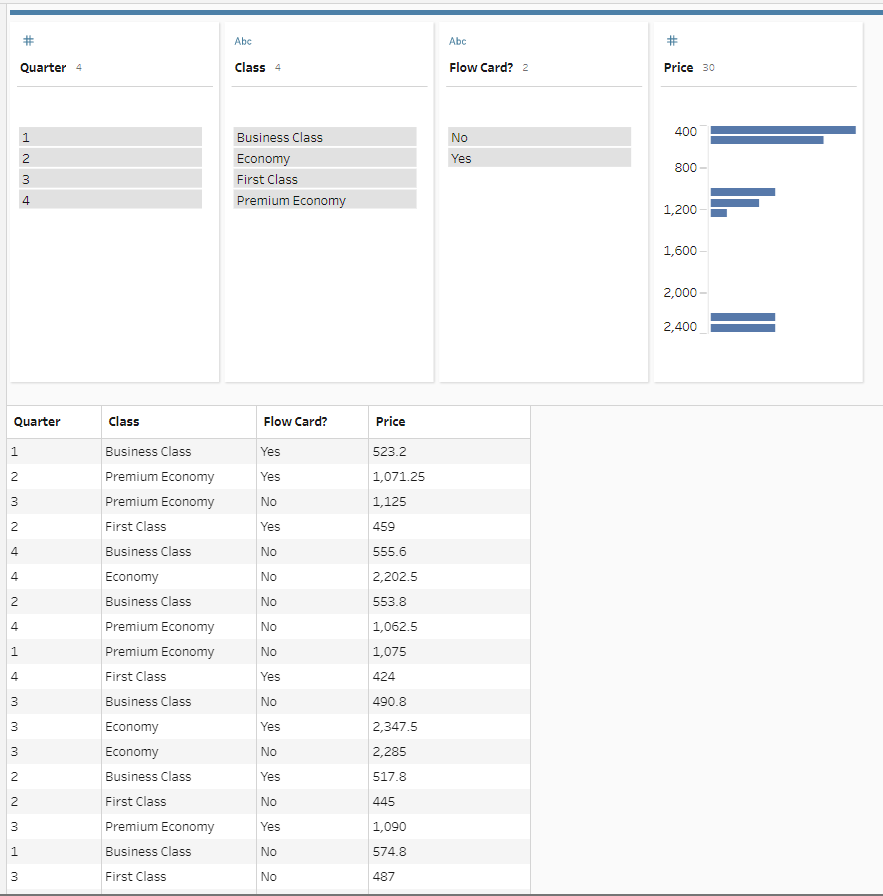
The output will now show us the median price by quarter, class and flow card?:
All Done!