


This part is also available as a Jupyter notebook here if you would like to follow along and run the code with me. This includes more detailed explanations of each step.
To create the scatter plot in python, import the following packages:
- Pandas (for and working with CSVs)
- Python Image Library
- Plotly (for graphing. You can also use Matplotlib, Seaborn, etc.)
- NumPy and Random (generating the points)
The overall process is as follows: load in a black and white image, convert that image to an array, use the array values to determine the bounds of the shape, then randomly generate a set number of points in that shape.
Once this is completed, it is easy to expand the function to make the plot symmetrical or lay the points in a grid.
Loading our Image
Start by using PIL to load the image and convert it to grayscale.
image_path = r"images\OakLeaf.png"
img = Image.open(image_path).convert("L")
display(img)

Then create a NumPy array. This also provides the height and width.
img_array = np.array(img)
#What are we making?
print(img_array[100])
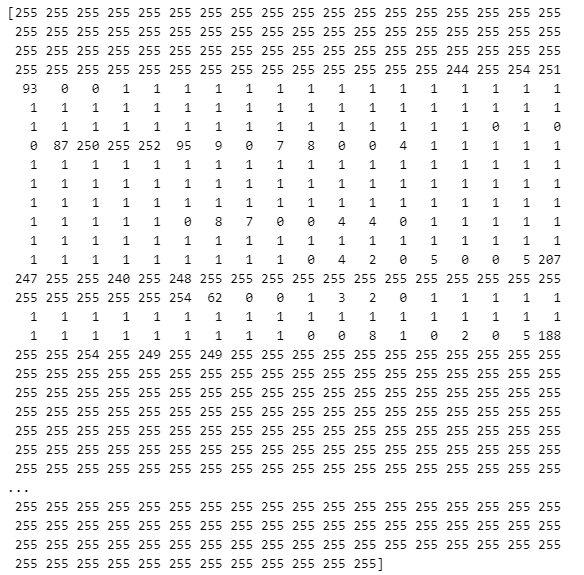
This is the image as a grid! All of the points correspond to a pixel in the data. Pixels with the value 255 are white, while pixels with 0 are black. This will be how we determine where the points need to be generated.
Finding The Shape of the Shape
To define a shape, look for pixels within a certain threshold of black. If a pixel's value is less than the threshold, store the X and Y position in a tuple and add it to an array of coordinates.
height, width = img_array.shape

#as white = 255 and black = 0, we could say anything under 128 is dark enough to be the shape we are looking for
threshold = 128

coords = []
#as a for loop
for y in range(height):
    for x in range(width):
        if img_array[y, x] < threshold:
            coords.append((x, y))

#as a list comprehension.
coords = [(x, y)
            for y in range(height)
            for x in range(width)
            if img_array[y, x] < threshold]
Now that the coordinates are defined, randomly sample a desired number of points.
num_points = 5000

sampled_coords = random.sample(coords, min(num_points, len(coords)))

Then store it in a dataframe for displaying and joining with the original dataset.

df = pd.DataFrame(sampled_coords, columns=['x', 'y'])
Seeing the Scatter Plot
fig = px.scatter(df, x="x", y="y", width=600, height=600)

fig.update_layout(
    plot_bgcolor='white',
    paper_bgcolor='white',
    xaxis=dict(showgrid=False, visible=True),
    yaxis=dict(showgrid=False, visible=True),
)

fig.update_traces(marker=dict(size=3, color='darkgrey', opacity=0.8))

fig.show()
Ta-Da!
It's upside down. This makes sense, all the points were appended to our array starting at y=0.
df['y'] = (height // 2) - df['y']

fig = px.scatter(df, x="x", y="y", width=600, height=600)

fig.update_layout(
    plot_bgcolor='white',
    paper_bgcolor='white',
    xaxis=dict(showgrid=False, visible=True),
    yaxis=dict(showgrid=False, visible=True),
)

fig.update_traces(marker=dict(size=3, color='darkgrey', opacity=0.8))

fig.show()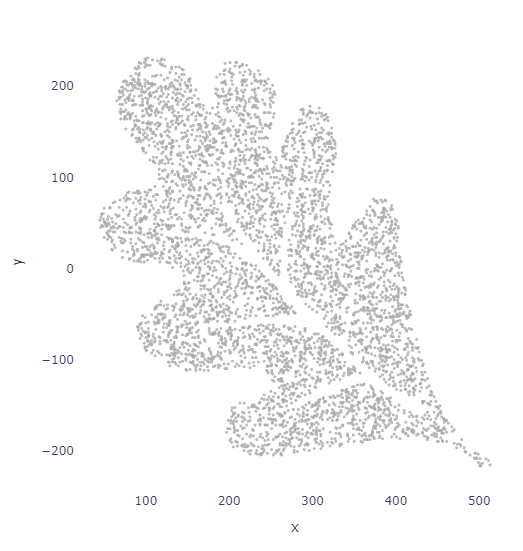
It's a very easy to flip.
I personally prefer the data be centered around (0,0) for tableau
df['x'] = df['x'] - (width // 2)
df['y'] = (height // 2) - df['y']
This is optional!
Putting it all together!
The above section breaks the code into more detail, but we really just want to quickly generate plots to test and see what we want to keep.
As such, it makes sense for this to be a function instead of segmented code blocks.
def image_to_points(image_path, num_points=500, threshold=128):
    # Load and convert image to grayscale
    img = Image.open(image_path).convert("L")
    img_array = np.array(img)

    height, width = img_array.shape

    # Get all pixel coordinates below the threshold
    coords = [(x, y) for y in range(height) for x in range(width) if img_array[y, x] < threshold]

    if len(coords) == 0:
        raise ValueError("No dark pixels found in image.")

    # Sample a limited number of points
    sampled_coords = random.sample(coords, min(num_points, len(coords)))
    df = pd.DataFrame(sampled_coords, columns=['x', 'y'])

    # Center coordinates around (0, 0)
    df['x'] = df['x'] - (width // 2)
    df['y'] = (height // 2) - df['y']  # Flip y

    return df

def plot_points(df, mark_size = 3):
    fig = px.scatter(df, x="x", y="y", width=600, height=600)

    fig.update_layout(
        plot_bgcolor='white',
        paper_bgcolor='white',
        xaxis=dict(showgrid=False, visible=True),
        yaxis=dict(showgrid=False, visible=True),
    )

    fig.update_traces(marker=dict(size=mark_size, color='darkgrey', opacity=0.8))
    fig.update_yaxes(scaleanchor="x", scaleratio=1)

    fig.show()
All in one step!
image_path = r"images\OakLeaf.png"
points_df = image_to_points(image_path, num_points=2000)
plot_points(points_df, 3)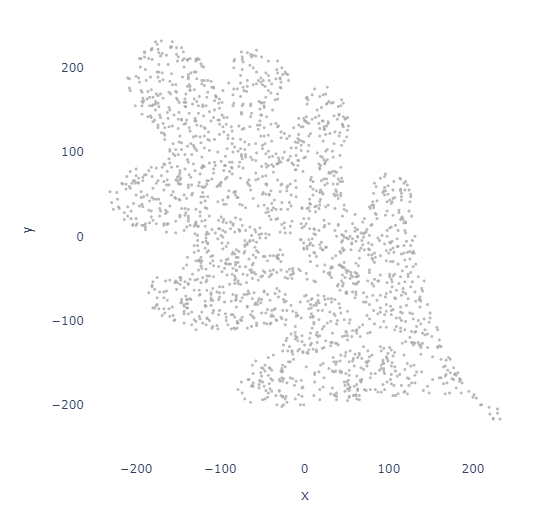
Expanding this with symmetry
One of my major gripes with Automeris was the lack of symmetrical points. Luckily, that is easy to add!
def image_to_points_symmetry(image_path, num_points=500, x_symmetry=False, y_symmetry=False, threshold=128):
    # Load and convert image to grayscale
    img = Image.open(image_path).convert("L")
    img = img.resize((256, 256))
    img_array = np.array(img)

    height, width = img_array.shape

    # Determine region to sample based on symmetry
    x_limit = width // 2 if x_symmetry else width
    y_limit = height // 2 if y_symmetry else height

    # Get coordinates of "black" pixels in region
    coords = [(x, y) for y in range(y_limit) for x in range(x_limit) if img_array[y, x] < threshold]

    if len(coords) == 0:
        raise ValueError("No dark pixels found in selected region of image.")

    sampled_coords = random.sample(coords, min(num_points, len(coords)))
    df = pd.DataFrame(sampled_coords, columns=['x', 'y'])

    mirrored = []

    if x_symmetry:
        mirrored.extend(df.assign(x=lambda d: width - d['x']).values)
    if y_symmetry:
        mirrored.extend(df.assign(y=lambda d: height - d['y']).values)
    if x_symmetry and y_symmetry:
        mirrored.extend(df.assign(x=lambda d: width - d['x'], y=lambda d: height - d['y']).values)

    if mirrored:
        df = pd.concat([df, pd.DataFrame(mirrored, columns=['x', 'y'])])

    df.drop_duplicates(inplace=True)

    # Center points around (0, 0)
    df['x'] = df['x'] - (width // 2)
    df['y'] = (height // 2) - df['y']  # Flip y

    return df

points_df = image_to_points_symmetry(image_path, num_points=2000, x_symmetry=True, y_symmetry=False)
plot_points(points_df)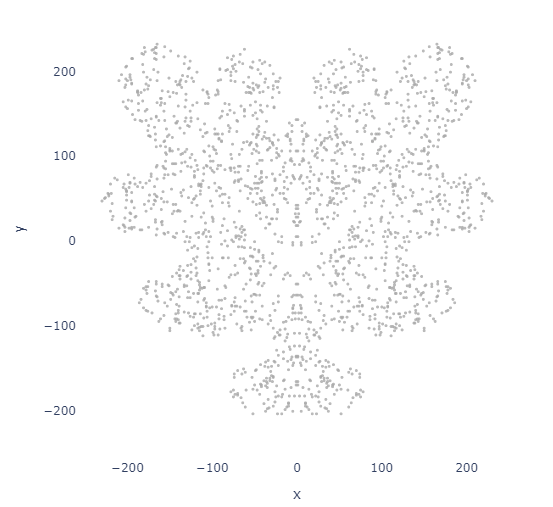
Grid Spacing
Instead of sampling randomly, we can also sample in a grid pattern for a more uniform look.
import numpy as np
import pandas as pd
from PIL import Image

def image_to_equally_spaced_points(image_path, num_points=500, threshold=128, filter_dark_pixels=True, max_attempts=31):
    # Load and convert image to grayscale
    img = Image.open(image_path).convert("L")
    img_array = np.array(img)
    height, width = img_array.shape
    aspect_ratio = width / height

    def generate_grid_points(grid_cols, grid_rows):
        x_coords = np.linspace(0, width - 1, grid_cols, dtype=int)
        y_coords = np.linspace(0, height - 1, grid_rows, dtype=int)
        xv, yv = np.meshgrid(x_coords, y_coords)
        return np.column_stack([xv.ravel(), yv.ravel()])

    # Try multiple attempts to adjust spacing dynamically
    for attempt in range(max_attempts):
        grid_cols = int(np.sqrt(num_points * aspect_ratio)) + attempt
        grid_rows = int(np.ceil(num_points / grid_cols)) + attempt

        points = generate_grid_points(grid_cols, grid_rows)

        if filter_dark_pixels:
            points = np.array([p for p in points if img_array[p[1], p[0]] < threshold])

        if len(points) >= num_points:
            break  # Enough points found, stop refining
        elif attempt == max_attempts - 1 and len(points) < num_points:
            print(f"Warning: Only {len(points)} points found after {max_attempts} attempts.")

    # Sample exactly num_points if more available, else return all
    if len(points) > num_points:
        np.random.seed(42)
        indices = np.random.choice(len(points), num_points, replace=False)
        points = points[indices]

    df = pd.DataFrame(points, columns=['x', 'y'])

    # Center points and flip y-axis
    df['x'] = df['x'] - (width // 2)
    df['y'] = (height // 2) - df['y']

    return df.reset_index(drop=True)
image_path = r"images\OakLeaf.png"
points_df = image_to_equally_spaced_points(image_path, num_points=1000, max_attempts=31)
plot_points(points_df, 5)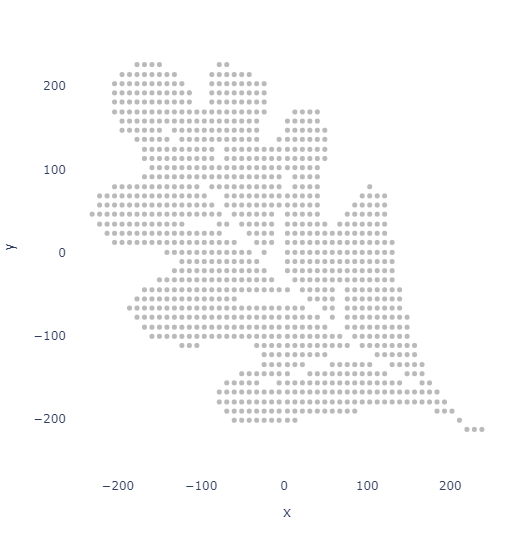
With the points generated, it is time to attach data to them!