Introduction
Welcome to the dreaded Dashboard week, known to dataschoolers as an extremely intense week due to having to extract, clean and prep data before visualising it in Tableau and blogging about the whole process, just within a day and then presenting the whole process the next morning. Now multiply that by 5 with no breaks in between! Sounds rather intense but so far it’s actually been really enjoyable and not as daunting as I first thought, having read previous dataschooler’s blogs. I have a had a good chance to practise and have found the first day so far like an extended makeovermonday combined with an Alteryx challenge. It’s a very valuable time to practise working on daily deliverables utilising all that we have trained in.
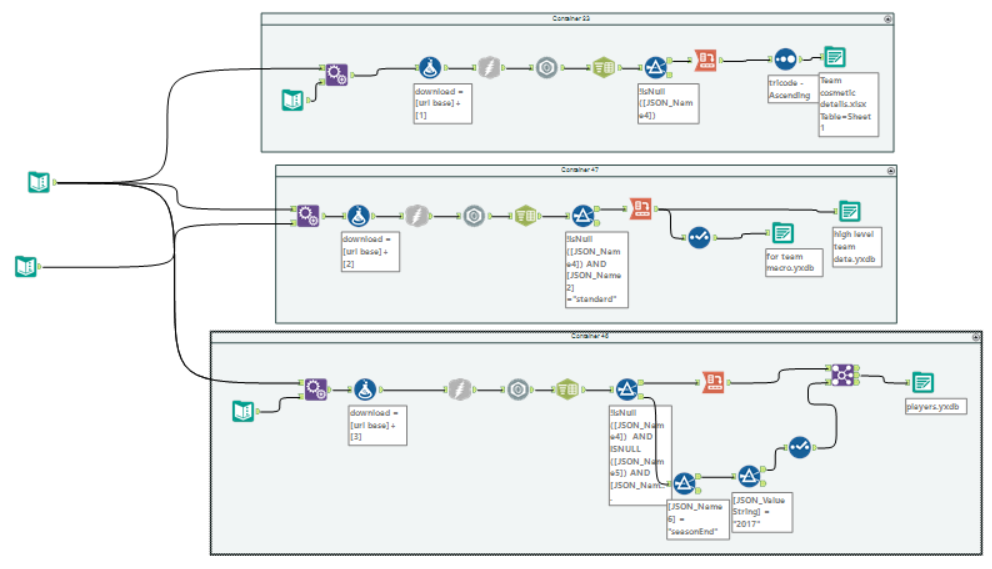
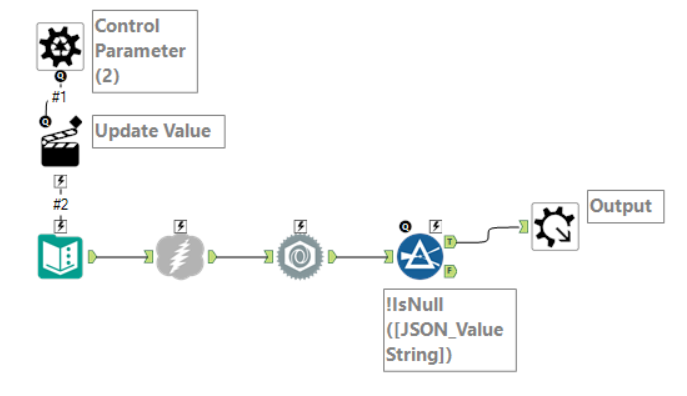
This project has provided me good API practice as I had to make multiple different calls (including batched calls) in order to obtain all the data I wanted. It has helped to solidify my understanding of extracting and parsing an API with Alteryx.
Andy did not make it easy for us on our first project of dashboard week. A quick google search would tell you that NBA’s APIs has been infamously elusive and poorly documented. For the most part, I found this to be true. I did, however, manage to find a link with documentation on two NBA APIs.
https://github.com/kshvmdn/nba.js/blob/master/docs/api/DATA.md
Choosing a Good API
There were two main APIs to choose from on the GitHub documentation: data.nba.net or stats.nba.com. I ended up using data.nba.net for most of my data.
The reason I went with data.nba.net was that each API call required fewer parameters to pass through and that the documentation was slightly better.
It should be noted for anyone who wants to utilise this API that some of the calls no longer work such as the “lastFiveGameTeamStats” call and “playerUberStats” returns empty.
Ease of use and documentation play a good hand in deciding whether you should go ahead with using an API or look for competitors.
Once I had my API I began making various workflows to extract my data.
Visualising the Data
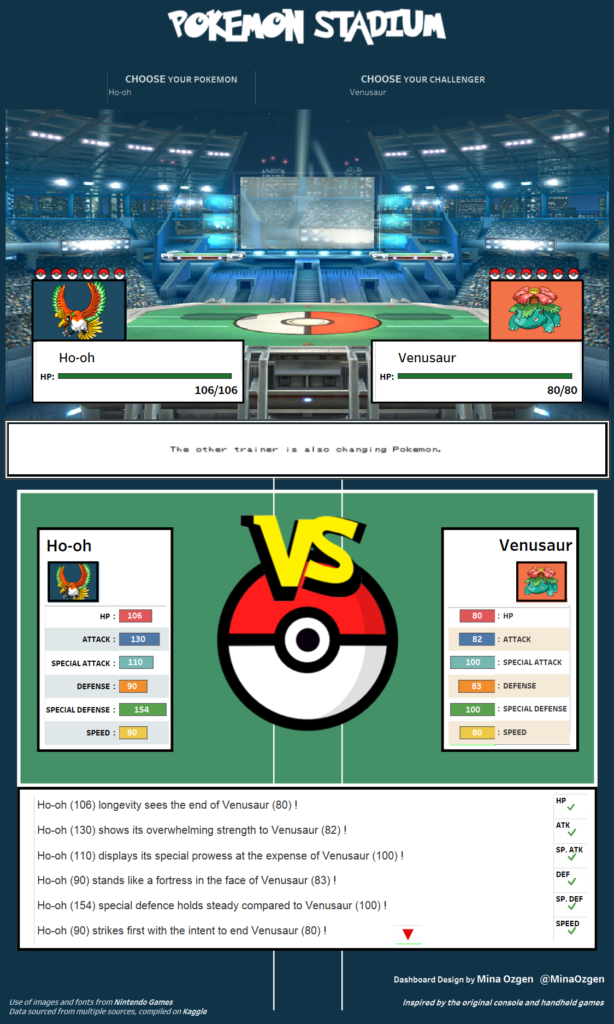
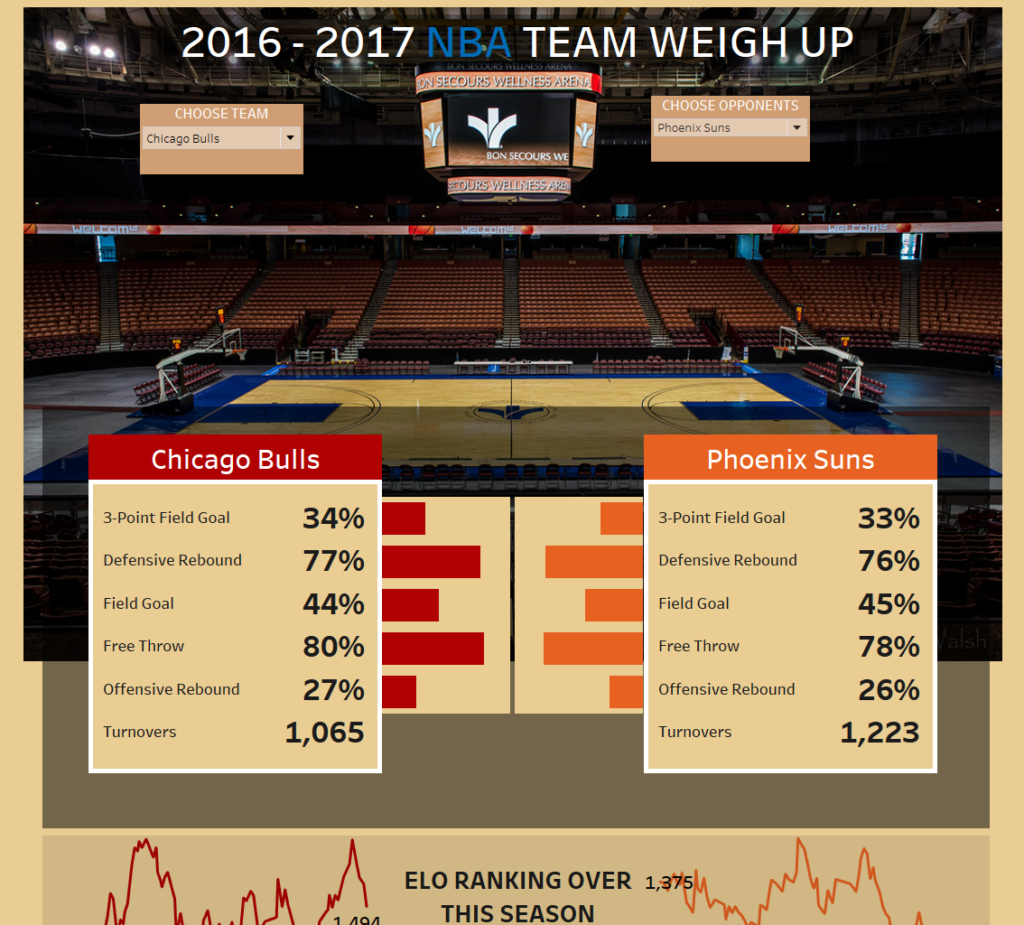
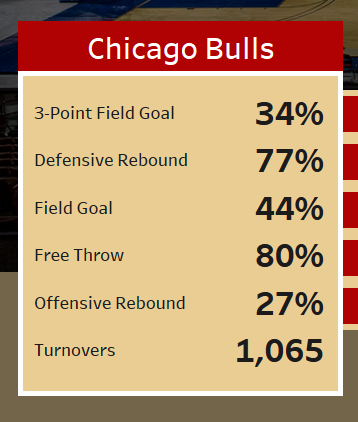
Most of the inspiration behind my design was based upon a visualisation I had done prior using Pokemon data in the theme of Pokemon Stadium (a very beloved game in the franchise). I built score cards of stats, similar to that of the stats cards of Pokemon and use a large picture of a stadium as the background image in the same manner as the Pokemon Stadium viz. Most of the similarity ends there as a lot of the technical difficulties of the NBA visualisation meant that I had to do things differently.
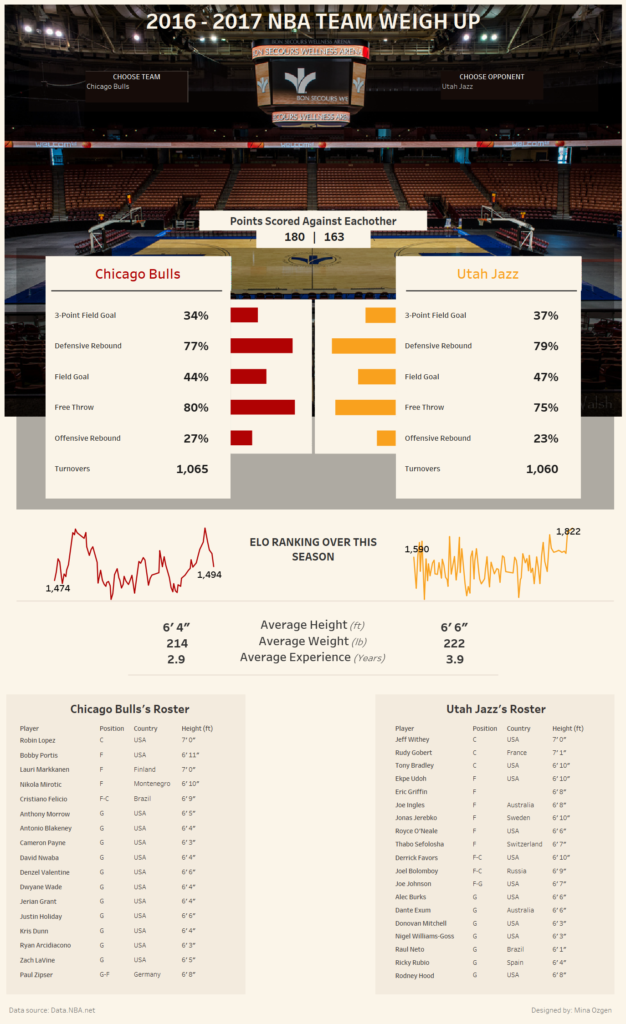
The most major issue I had was to do with colour on the page. At times when I was building it out, there was too much/too bold of colour on the dashboard. Using the golden brown from the image as a background was strong and it was too clashing, especially by the time I got to the dynamic colour headers, titling and the coloured spark lines.
![]()
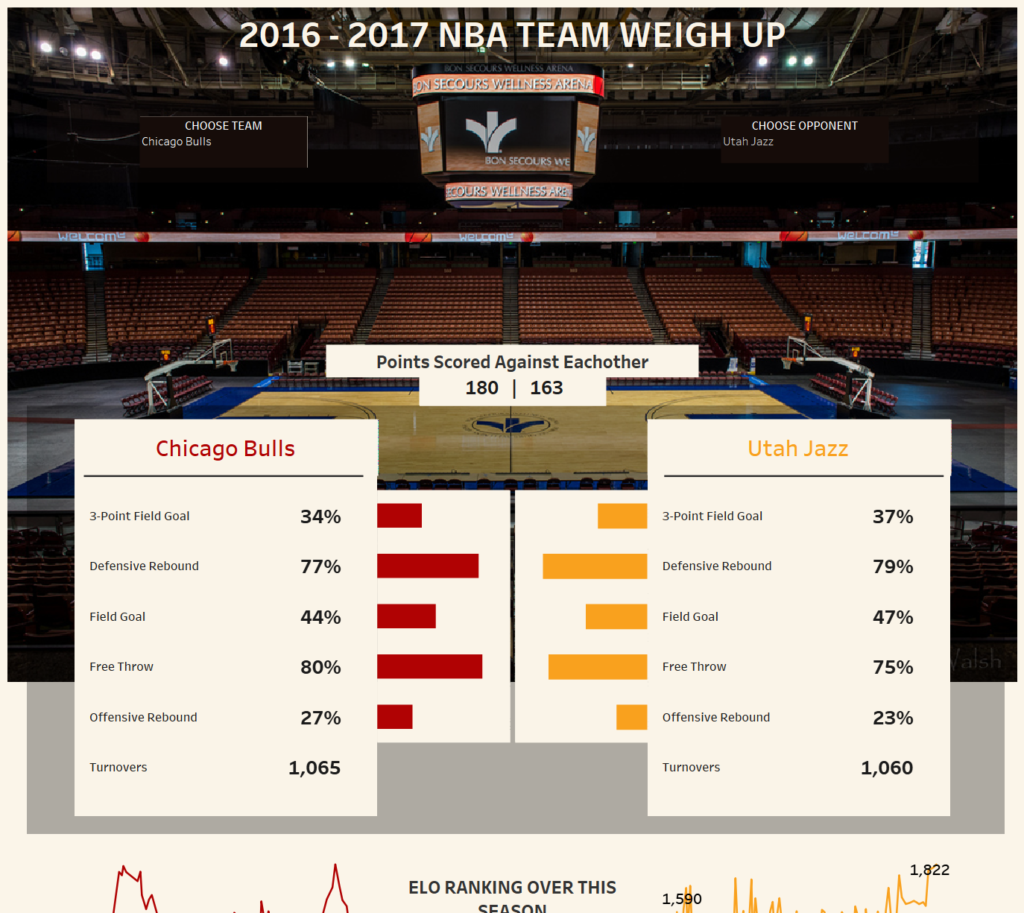
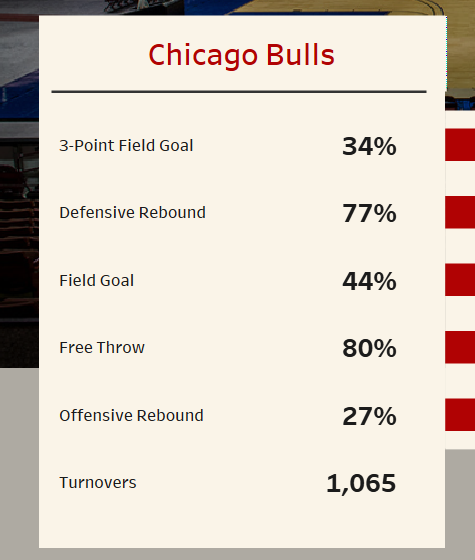
This lead to me doing a complete 180 and lightening up the background so much it is impossible to tell it was originally from the picture. I also converted from card headers (even though I do love them) to just coloured text with dividers (to reduce the large block of bold colour). I’m still undecided if I like the changes entirely but they have simplified the design and dealt with some of the colour issues I had.
Final Thoughts
At the end of today, I am still not happy with how it has turned out as a dashboard, but it has been a great learning experience. I feel like at some point I’ll have a play with the data again to visualise it since it is rich and I have only scratched the surface.
Pokemon Stadium Dashboard:
https://public.tableau.com/profile/mina.ozgen#!/vizhome/POKEMONSTADIUM/Dashboard1
NBA Stadium Dashboard:
https://public.tableau.com/profile/mina.ozgen#!/vizhome/NBASTADIUM/teamdashboard