


Day 3 had the greatest difference between my excitement and anticipation at the start of the day and my frustration by the end of it. At the start of the day, I was excited to start on a project based entirely on transport data. However, when it actually came to finding and using this data it was a lot more like this.

The Challenge
Andy tasked me with finding data on the public transport within Paris.
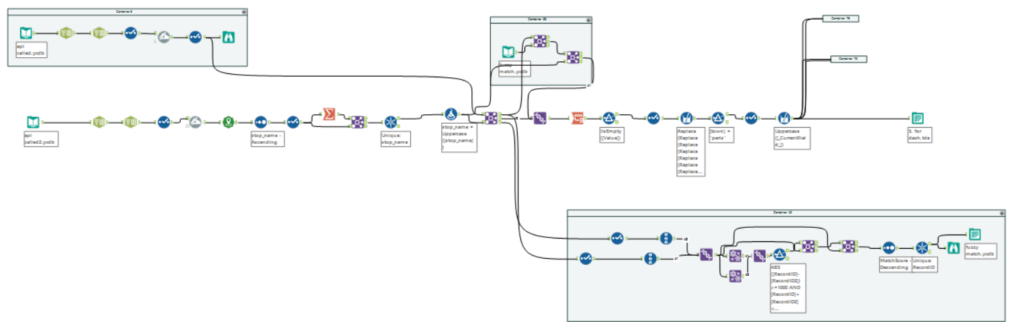
Once I finally found the correct API and “documentation” for it I started to figure out what I wanted. I ended up using three of their data sets, two of which I called with an API and one of which I had to download as a zip folder (the route icons).
The main data set on traffic was only 369 rows, one for each station for their entire inbound traffic in 2016. So while our task was to utilise an API to build our dashboards, it would have been entirely appropriate to simply download a dataset of this size and infrequency of publication as a CSV.
The data set contained the 2016 inbound figure for a station with a list of its routes. What compounded this problem is that when I tried to join their spatial file of the stations to the traffic information of the stations the names about half of the names did not match – despite them both being from the same source. I used fuzzy match to generate a reference table for around 1/3 of the missing names (and had to plain-out lose the rest). I ended up with just over 200 records by the end.
Visualising in Tableau
When data is this aggregated, a single value for 2016, you run into the challenge of limited analysis. It becomes very difficult to analyse the data because it is too high level to say anything insightful or accurate. Most of the visualisation was centred around showing the traffic by route, station or area. By slicing up the data by my categorical fields I can extend this data a bit further in my analysis still at the risk of being slightly inaccurate. I cannot attribute exact numbers to each route since there is no way of knowing at stations with multiple routes which route they actually took. These are more like the maximum possible traffic for that route than the actual per route. For a lot of the high traffic stations, there was mostly only one route for those stations so fortunately, the values are not too far of the actuals.
Luckily because the website had a file for the icons, I was able to tie the routes into the icons and use that as part of my design – still not sure why they had this information over an actual route path or route shape file and I guess I will never know. I made the routes into a header and added a bar chart summarising each (once again with a little bit of caution on the exact figures). I went with a map (because everybody but Andy loves a map to interact with) of each station and a hexibin map as well to summarise the areas (but this does not tell much due to the distribution of the data)
I used a dark dashboard in order to get away with all the colour I was using on the maps and with the icons and I think from this aspect the viz works well. Whilst I am not 100% content with the analysis of the dashboard, considering the lack of granularity I am happy enough with the result and the overall design of the dashboard.
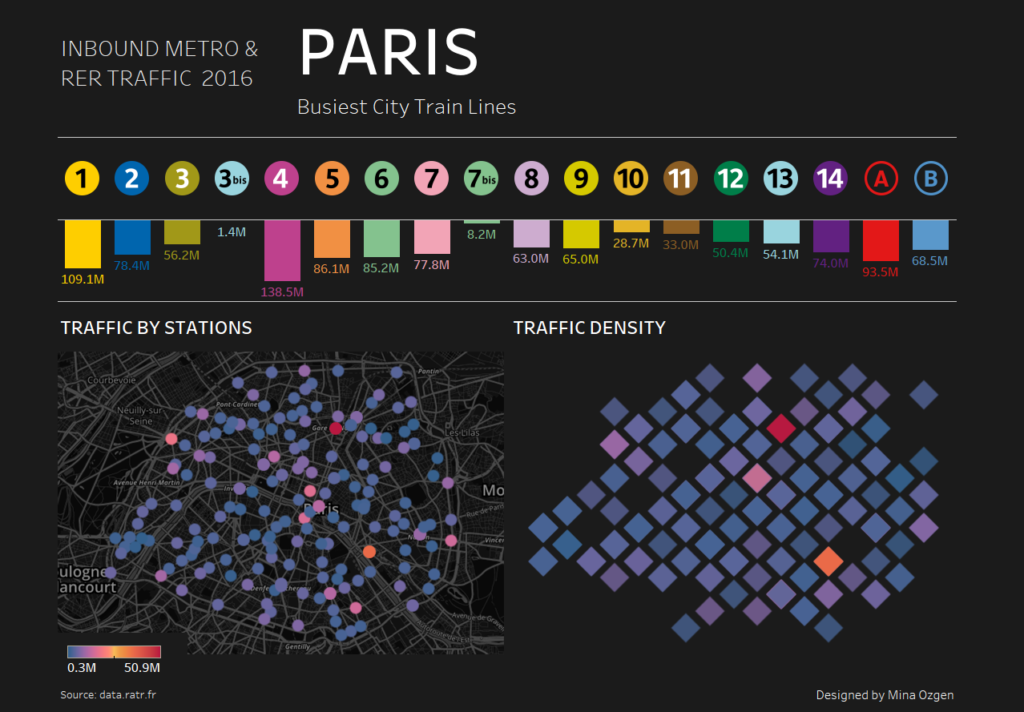
Paris Transport Dashboard: https://public.tableau.com/views/ParisInboundTrainTraffic2016/Dashboard1