


Learning over Producing
Today was a great day for learning but a terrible day for vizzing. Thus far I found today the hardest day to viz (though yesterday’s mapping was difficult as well). The reason I found this data so difficult to viz was that I had little interest in all these nutritional values particularly by the end of a day working intensively with ParseHub and Alteryx.
The Challenge
The data set we were given was the USDA food composition databases, accessible from ndb.nal.usda.gov. Andy tasked me with searching for all products with “burrito” in the name. They did have an API but with so many of us making so many requests we realised most of us would have to web scrape instead.
When we searched for our food item the website `would return a list of links spread across a few pages. Inside each of these links was a nutrients table. We had to somehow extract a data set based off of all the tables inside the links across all pages. This was a perfect excuse to learn ParseHub so this is what I spent most of my time doing. I even got it working properly on the test run but for some reason on the actual run it would not run correctly and so I went back to Alteryx in the end for my data preparation (Alteryx never fails me in the end).
Moving from ParseHub to Alteryx
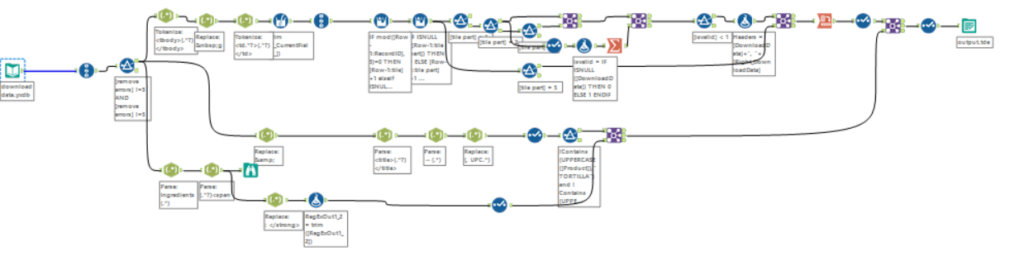
I utilised ParseHub to return all the links at least – so that my efforts in ParseHub at least resulted in something productive. I fed this list into the download tool in Alteryx to grab the HTML of each page. I throttled my downloads so that I did not request from the website too quickly, this is an important part of web scraping so that you do not push the website too much (and accidentally take them down) but also so that you do not get yourself blocked or having failing requests. I parsed all this data in Alteryx using the regex tools. I also decided to make each measure its own field whilst most people this week went “tall” in their structure (one column for all the measures and another column to identify which measure it was). I decided against this because I knew I wanted to make scatter plots and it would be easier for me to develop and work with the data to make these scatter plots if it was structured one column, one measure.
Finding a Point of Interest and Visualising in Tableau
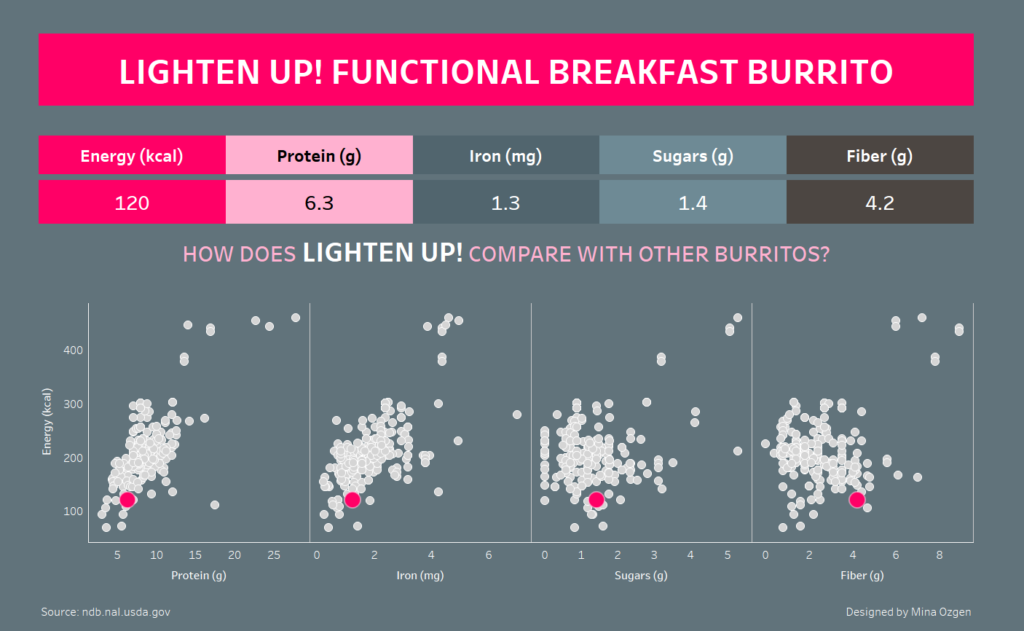
I spent a while looking for some interesting ingredients (without much avail) and then moved onto product names and managed to find an interestingly titled burrito called “Lighten up! Breakfast Burrito”. After a few more rabbit-hole considerations of what I could viz with this data, I settled on focusing on this “Lighten up! burrito”.
I threw together a header and multiple scatter plot, formatted to highlight the lighten up burrito and add a colour scheme and I was done. The actual Tableau portion was done in about 15 minutes. The rest of the time I had spent learning and practising tools. I feel like my knowledge and ability in both ParseHub and Regex parsing web pages has come a long way in one day. So even though I was not happy with my final viz, I was happy with what I had learned by the end of the day.
Lighten up! Burrito Dashboard: https://public.tableau.com/views/Theveryfunctionalfunctionalburrito/Burrito