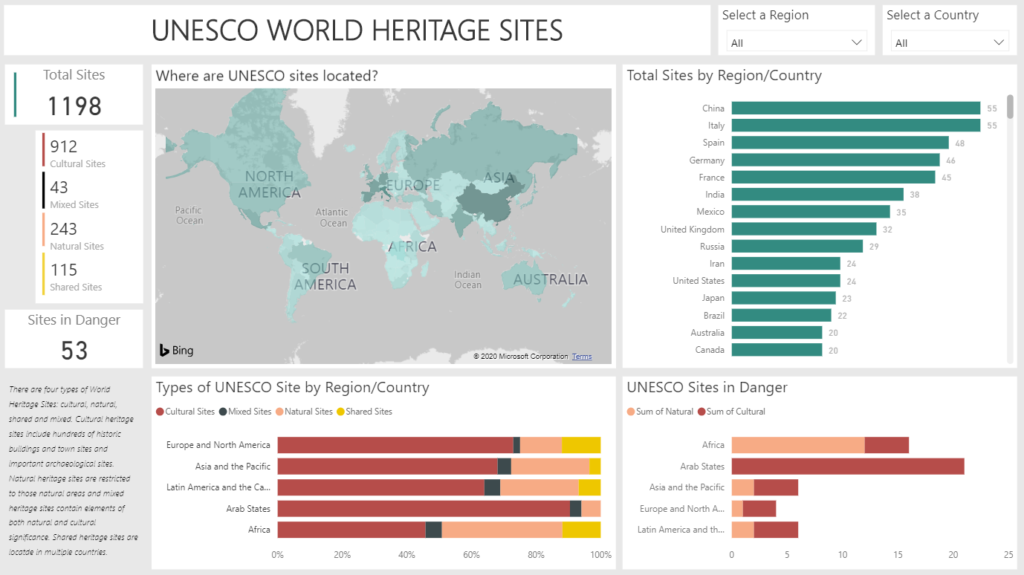
I definitely spoke too soon when I said it couldn’t get any harder than day 1… Today we were tasked with web scraping a list of UNESCO world heritage sites from Wikipedia and creating a viz in Power BI.
The Wikipedia page that we were web scraping had a table containing the number of cultural, natural, mixed, shared and total heritage sites for each country. Clicking on each country re-directed you to another page with another table with more specific information about the heritage sites within that country which we also had to web-scrape.
My first task was to web-scrape the main countries table. I read a blog written by Robbin Vernooij about Web Scraping which helped me a lot so huge shout out to Robbin for your help! (find the blog here : /robbin-vernooij/web-scraping-html-tables-an-alteryx-workflow-and-r-script-example/ )
This first web scrape took longer than I initially expected but I felt great once I had finished knowing that I had successfully created a table that matched the Wiki table.
Now onto task 2 which was to web scrape the individual country tables. I went into this task confidently as I had just web scraped the first table so how different could the logic be? Turns out it was a lot more complicated and I ended up trying multiple different approaches with varying levels of success.
The reason why I found this so challenging was because the tables for each country were in different formats. They contained different fields and different numbers of fields. Therefore I was trying to build a workflow that was dynamic enough to work for each different format.
This task took me a long time so after a while of trying different things I decided to take what I had and put it into Power BI. I found some additional data online about heritage sites that were in danger so i decided to include this data too.
From the data that I had, I decided to create a dashboard which showed where all the different types of heritage sites were located around the world and how many of these were considered to be in danger by UNESCO.
My final dashboard:

I had an idea of how I wanted my dashboard to look, but the idea I had was based off of it being built in Tableau rather than Power BI so i found it a challenge to try and replicate what i wanted in the different tool. However there are some pre-built functions of PBI such as filtering that made creating the dashboard more simple.
Overall, Day 3 was a real challenge however I enjoyed developing my web-scraping skills and exploring the functionality of a different tool!
