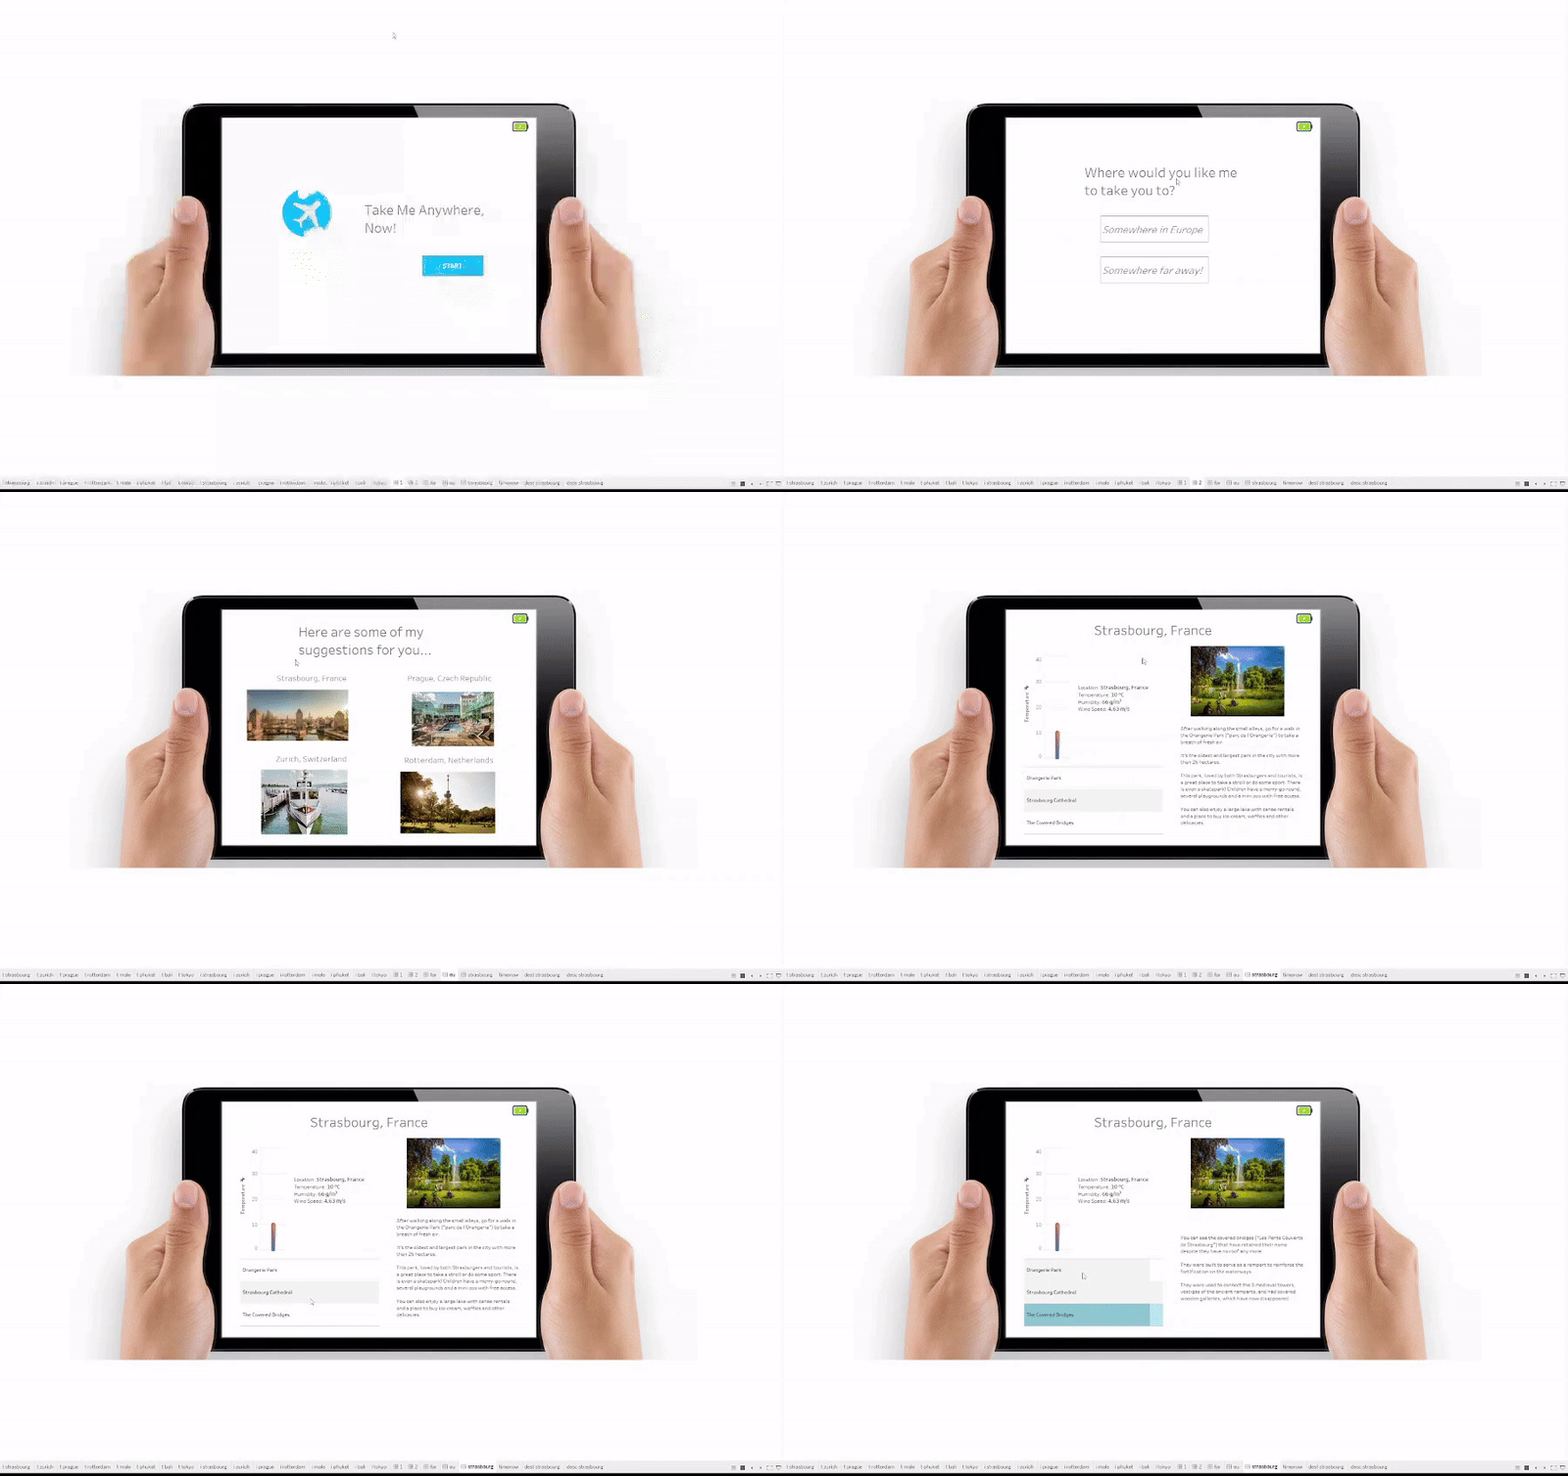
On day 3, we needed to do some API calls to retrieve the weather, temperature, and pollution index for any countries of our choice. The limitation is, that we can only get the data for the "now" time, meaning we cannot do any time series analysis this time. Okay good, I can still try to make something like showing comparison between different cities, said I. So I decided that I'd take data from just a few cities for this project, and compare it to the city of our office, which is in Hamburg, Germany. The theme would be something like "If you were to suddenly go on a vacation right now, where would you go?" kind of thing.

So I started by picking some cities for a good vacation destination: 4 from within Europe, and another four places that are further away from Germany. The API call was overall OK, though some of the performances are limited because we only used the free account. It was limited to four to five API calls per minute, which was not too bad, since I only needed eight API calls for eight cities.
After done gathering information using API, I added some additional info manually from various websites, to get me up to three tourism spots from each city, that we can visit. The deal is, the App should provide the eight cities as options to choose, and if one city is clicked, it will show the three tourism spots as information, while also showing the weather in that city. The temperature will be shown as comparison, between temperature in Hamburg and the Temperature in the destination.
Here's what it looks like. It's still not yet finished, and I plan to work more on it on the 4th day of the Dashboard week, because it's still pretty far from finish.

